
-
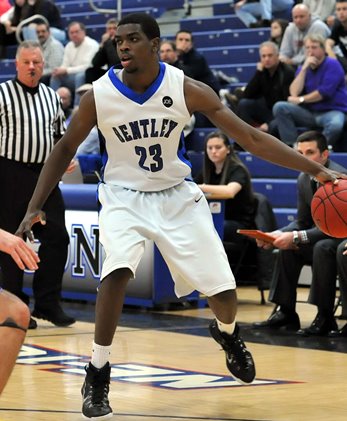
- Height:
- 6-4
-
- Weight:
- 195
-
- Year:
- Jr.
-
- Hometown:
- Linden, N.J.
-
- High School:
- Linden
-
- Position:
- F
-
- Mile Time:
- 5:21
-
- gp
- 27
-
- pts/g
- 6.7
-
- fg %
- 50.0
-
- 3pt %
- 37.5
-
- ft %
- 70.7
-
- reb/g
- 3.9
-
- a/g
- 0.6
Bio
Career Notes
Career averages of 5.4 points and 2.9 rebounds with a .468 field goal percentage in 78 career games (22 starts) … PPG, RPG and FG% have all improved each season he’s been at Bentley … career totals include 424 points and 224 rebounds.
2014-15 Season
Appeared in all 27 games and was a starter in the final 20 … averaged 6.7 points and 3.9 rebounds while playing 22 minutes a game … shot .500 overall, including .558 from inside the three-point line … away from home, shot 53 percent and made 9 of 22 threes (.409) while scoring 7.4 points a game … scored in doubles six times, including four times in a six-game span Nov. 22-Dec. 9 … season-high 16 points against Bridgeport Nov. 30 and again Dec. 9 at Molloy, a game in which he was 7-of-8 from the field … career-best eight rebounds Dec. 3 against Merrimack.
2013-14 Season
Appeared in 28 games off the bench, averaging 12.8 minutes, 5.3 points and 2.4 rebounds … shot 45 percent overall, 41 percent from three and just under 80 percent from the line … averaged 6.1 points and 14.7 minutes over the second half of the season, up from 4.4 and 10.9 during the first half … In season’s final three games, made five of eight three pointers and averaged 9.7 points … scored in doubles six times, including a season-best 13 at Franklin Pierce Dec. 10 and at Assumption Feb. 6 … was third on team in offensive rebounds (31) despite being seventh in minutes.
2012-13 Season
Averaged 4.1 points and 2.3 rebounds while playing 15.5 minutes a game in 23 contests … put up a career-best 16 points in 25 minutes off the bench Feb. 2 at Southern Connecticut State … that earned him his first two collegiate starts, Feb. 6 at Merrimack and Feb. 10 at Saint Anselm … also scored 12 in back-to-back games against American International Jan. 15 and at Saint Rose Jan. 19 … made five of seven shots in both the Southern Connecticut and Saint Rose games … shot 44 percent from three during his final 13 games, making 11 of 25 from downtown … had at least five rebounds six times, including five times in a six-game span Feb. 2-20.
Before Bentley
2012 graduate of Linden High School who was a second-team All-Union County selection … helped Linden capture the Section 2 Group 4 state championship … Star Ledger All-Group 3 third team … scored 22 points in North-South All-State Game following his senior season … also played with Team NJ Select Stars.
Personal
Is majoring in marketing … age as of Nov. 15, 2014: 20 … son of Vincent and Kimberly Phelps … has two brothers, William (16) and Shamar, and one sister, Sonya.
2013-14 Statistics 2012-13 Statistics
Player Profile
| Overall | Conf | |||
|---|---|---|---|---|
| Games | 27 | 21 | ||
| Games started | 20 | 17 | ||
| Minutes | 593 | 469 | ||
| Minutes per game | 22.0 | 22.3 | ||
| FG | 63-126 | 48-101 | ||
| FG Pct | 50.0 | 47.5 | ||
| 3PT | 15-40 | 11-31 | ||
| 3PT Pct | 37.5 | 35.5 | ||
| FT | 41-58 | 31-47 | ||
| FT Pct | 70.7 | 66.0 | ||
| Off rebounds | 41 | 35 | ||
| Def rebounds | 64 | 54 | ||
| Total rebounds | 105 | 89 | ||
| Rebounds per game | 3.9 | 4.2 | ||
| Personal fouls | 46 | 35 | ||
| Disqualifications | 0 | 0 | ||
| Assists | 17 | 15 | ||
| Turnovers | 26 | 19 | ||
| Assist to turnover ratio | 0.7 | 0.8 | ||
| Steals | 10 | 7 | ||
| Blocks | 11 | 11 | ||
| Points | 182 | 138 | ||
| Points per game | 6.7 | 6.6 | ||
| Points per 40 min | 12.3 | 11.8 | ||
Game Log - Shooting
| Date | Opponent | Score | gs | min | fg | pct | 3pt | pct | ft | pct | pts |
|---|---|---|---|---|---|---|---|---|---|---|---|
| Oct 31 | St. Mary's (Canada) | W, 121-70 | - | 14 | 2-4 | 50.0 | 2-3 | 66.7 | 5-8 | 62.5 | 11 |
| Nov 1 | St. Francis Xavier (Canada) | W, 103-59 | - | 16 | 5-9 | 55.6 | 1-2 | 50.0 | 0-0 | - | 11 |
| Nov 14 | Philadelphia U. | W, 72-63 | - | 25 | 1-5 | 20.0 | 1-2 | 50.0 | 0-0 | - | 3 |
| Nov 15 | Holy Family | L, 68-67 | - | 11 | 0-1 | 0.0 | 0-1 | 0.0 | 0-1 | 0.0 | 0 |
| Nov 19 | at Assumption | L, 81-74 | - | 18 | 3-5 | 60.0 | 1-2 | 50.0 | 2-3 | 66.7 | 9 |
| Nov 22 | Stonehill | L, 90-85 | - | 23 | 4-7 | 57.1 | 0-1 | 0.0 | 3-4 | 75.0 | 11 |
| Nov 25 | at Southern N.H. | L, 74-67 | - | 23 | 2-5 | 40.0 | 0-3 | 0.0 | 2-2 | 100.0 | 6 |
| Nov 30 | Bridgeport | W, 104-57 | - | 16 | 4-6 | 66.7 | 1-2 | 50.0 | 7-7 | 100.0 | 16 |
| Dec 3 | Merrimack | W, 86-79 | - | 29 | 3-3 | 100.0 | 0-0 | - | 6-7 | 85.7 | 12 |
| Dec 6 | at St. Michael's | L, 95-87 | 1 | 26 | 2-5 | 40.0 | 1-3 | 33.3 | 3-5 | 60.0 | 8 |
| Dec 9 | at Molloy | W, 99-92 | 1 | 37 | 7-8 | 87.5 | 1-2 | 50.0 | 1-1 | 100.0 | 16 |
| Dec 14 | Le Moyne | W, 73-67 | 1 | 18 | 0-3 | 0.0 | 0-1 | 0.0 | 0-0 | - | 0 |
| Dec 19 | at Caldwell | W, 80-70 | 1 | 18 | 2-3 | 66.7 | 1-2 | 50.0 | 2-2 | 100.0 | 7 |
| Dec 21 | at New Haven | W, 74-63 | 1 | 17 | 1-2 | 50.0 | 0-0 | - | 0-0 | - | 2 |
| Dec 31 | Franklin Pierce | W, 84-68 | 1 | 20 | 3-5 | 60.0 | 1-2 | 50.0 | 0-0 | - | 7 |
| Jan 3 | Saint Anselm | W, 79-72 | 1 | 24 | 3-8 | 37.5 | 0-1 | 0.0 | 1-2 | 50.0 | 7 |
| Jan 10 | at Southern Conn. St. | L, 89-77 | 1 | 25 | 3-5 | 60.0 | 1-2 | 50.0 | 1-2 | 50.0 | 8 |
| Jan 14 | at Adelphi | W, 75-67 | 1 | 21 | 4-7 | 57.1 | 1-2 | 50.0 | 0-1 | 0.0 | 9 |
| Jan 17 | American Int'l | L, 84-77 | 1 | 27 | 1-4 | 25.0 | 0-0 | - | 5-8 | 62.5 | 7 |
| Jan 21 | New Haven | W, 65-56 | 1 | 19 | 3-4 | 75.0 | 1-1 | 100.0 | 0-0 | - | 7 |
| Jan 29 | at Saint Rose | W, 87-69 | 1 | 18 | 1-3 | 33.3 | 0-1 | 0.0 | 0-1 | 0.0 | 2 |
| Jan 31 | Pace | W, 75-53 | 1 | 24 | 1-3 | 33.3 | 1-2 | 50.0 | 0-0 | - | 3 |
| Feb 4 | Assumption | W, 81-80 | 1 | 22 | 2-2 | 100.0 | 0-0 | - | 2-3 | 66.7 | 6 |
| Feb 7 | at Saint Anselm | L, 80-59 | 1 | 20 | 0-4 | 0.0 | 0-0 | - | 1-2 | 50.0 | 1 |
| Feb 10 | at Merrimack | L, 78-61 | 1 | 17 | 1-3 | 33.3 | 0-1 | 0.0 | 1-2 | 50.0 | 3 |
| Feb 14 | St. Michael's | W, 77-76 | 1 | 13 | 1-3 | 33.3 | 1-3 | 33.3 | 0-0 | - | 3 |
| Feb 18 | Southern N.H. | L, 85-73 | 1 | 20 | 2-6 | 33.3 | 0-2 | 0.0 | 0-0 | - | 4 |
| Feb 21 | at Stonehill | L, 73-72 | 1 | 29 | 5-7 | 71.4 | 2-2 | 100.0 | 1-2 | 50.0 | 13 |
| Feb 24 | at Franklin Pierce | L, 85-84 | 1 | 33 | 4-9 | 44.4 | 1-2 | 50.0 | 3-3 | 100.0 | 12 |
Game Log - Ball control
| Date | Opponent | Score | gs | min | off | def | reb | ast | to | a/to | stl | blk | pf | dq |
|---|---|---|---|---|---|---|---|---|---|---|---|---|---|---|
| Oct 31 | St. Mary's (Canada) | W, 121-70 | - | 14 | 1 | 1 | 2 | 2 | 1 | 2.0 | 2 | 1 | 2 | 0 |
| Nov 1 | St. Francis Xavier (Canada) | W, 103-59 | - | 16 | 2 | 3 | 5 | 0 | 0 | - | 2 | 0 | 2 | 0 |
| Nov 14 | Philadelphia U. | W, 72-63 | - | 25 | 1 | 1 | 2 | 0 | 0 | - | 1 | 0 | 1 | 0 |
| Nov 15 | Holy Family | L, 68-67 | - | 11 | 0 | 0 | 0 | 1 | 1 | 1.0 | 0 | 0 | 3 | 0 |
| Nov 19 | at Assumption | L, 81-74 | - | 18 | 2 | 1 | 3 | 0 | 1 | 0.0 | 0 | 0 | 3 | 0 |
| Nov 22 | Stonehill | L, 90-85 | - | 23 | 3 | 2 | 5 | 3 | 0 | - | 0 | 2 | 3 | 0 |
| Nov 25 | at Southern N.H. | L, 74-67 | - | 23 | 2 | 2 | 4 | 1 | 0 | - | 1 | 0 | 3 | - |
| Nov 30 | Bridgeport | W, 104-57 | - | 16 | 2 | 4 | 6 | 1 | 0 | - | 1 | 0 | 1 | 0 |
| Dec 3 | Merrimack | W, 86-79 | - | 29 | 2 | 6 | 8 | 1 | 4 | 0.3 | 0 | 2 | 1 | 0 |
| Dec 6 | at St. Michael's | L, 95-87 | 1 | 26 | 2 | 4 | 6 | 0 | 2 | 0.0 | 2 | 0 | 4 | 0 |
| Dec 9 | at Molloy | W, 99-92 | 1 | 37 | 0 | 3 | 3 | 0 | 5 | 0.0 | 0 | 0 | 2 | - |
| Dec 14 | Le Moyne | W, 73-67 | 1 | 18 | 1 | 1 | 2 | 2 | 0 | - | 0 | 1 | 2 | 0 |
| Dec 19 | at Caldwell | W, 80-70 | 1 | 18 | 2 | 1 | 3 | 0 | 1 | 0.0 | 0 | 0 | 3 | - |
| Dec 21 | at New Haven | W, 74-63 | 1 | 17 | 1 | 1 | 2 | 0 | 0 | - | 1 | 0 | 1 | 0 |
| Dec 31 | Franklin Pierce | W, 84-68 | 1 | 20 | 1 | 2 | 3 | 0 | 1 | 0.0 | 0 | 0 | 3 | 0 |
| Jan 3 | Saint Anselm | W, 79-72 | 1 | 24 | 1 | 5 | 6 | 0 | 0 | - | 0 | 1 | 0 | 0 |
| Jan 10 | at Southern Conn. St. | L, 89-77 | 1 | 25 | 2 | 2 | 4 | 0 | 0 | - | 0 | 0 | 1 | 0 |
| Jan 14 | at Adelphi | W, 75-67 | 1 | 21 | 5 | 1 | 6 | 0 | 1 | 0.0 | 1 | 2 | 1 | 0 |
| Jan 17 | American Int'l | L, 84-77 | 1 | 27 | 2 | 1 | 3 | 0 | 0 | - | 0 | 0 | 1 | 0 |
| Jan 21 | New Haven | W, 65-56 | 1 | 19 | 1 | 5 | 6 | 3 | 0 | - | 1 | 0 | 0 | 0 |
| Jan 29 | at Saint Rose | W, 87-69 | 1 | 18 | 2 | 5 | 7 | 1 | 1 | 1.0 | 0 | 0 | 1 | 0 |
| Jan 31 | Pace | W, 75-53 | 1 | 24 | 0 | 2 | 2 | 0 | 2 | 0.0 | 1 | 2 | 3 | 0 |
| Feb 4 | Assumption | W, 81-80 | 1 | 22 | 0 | 2 | 2 | 0 | 0 | - | 0 | 0 | 1 | 0 |
| Feb 7 | at Saint Anselm | L, 80-59 | 1 | 20 | 2 | 0 | 2 | 0 | 0 | - | 0 | 0 | 1 | 0 |
| Feb 10 | at Merrimack | L, 78-61 | 1 | 17 | 2 | 4 | 6 | 1 | 2 | 0.5 | 0 | 0 | 0 | 0 |
| Feb 14 | St. Michael's | W, 77-76 | 1 | 13 | 0 | 1 | 1 | 2 | 0 | - | 0 | 0 | 1 | 0 |
| Feb 18 | Southern N.H. | L, 85-73 | 1 | 20 | 1 | 1 | 2 | 1 | 1 | 1.0 | 0 | 0 | 2 | 0 |
| Feb 21 | at Stonehill | L, 73-72 | 1 | 29 | 3 | 3 | 6 | 0 | 3 | 0.0 | 1 | 1 | 2 | - |
| Feb 24 | at Franklin Pierce | L, 85-84 | 1 | 33 | 1 | 4 | 5 | 0 | 1 | 0.0 | 0 | 0 | 2 | 0 |
Career Stats - Shooting per game
| gp | gs | min/g | fg/g | pct | 3pt/g | pct | ft/g | pct | ppg | |
|---|---|---|---|---|---|---|---|---|---|---|
| 2012-13 | 23 | 2 | 15.5 | 1.5-3.4 | 43.6 | 0.5-1.3 | 38.7 | 0.7-1.0 | 65.2 | 4.1 |
| 2013-14 | 28 | - | 12.8 | 1.7-3.8 | 45.3 | 0.6-1.4 | 41.0 | 1.2-1.6 | 79.5 | 5.3 |
| 2014-15 | 27 | 20 | 22.0 | 2.3-4.7 | 50.0 | 0.6-1.5 | 37.5 | 1.5-2.1 | 70.7 | 6.7 |
| 2015-16 | 1 | - | 1.0 | 0.0-0.0 | - | 0.0-0.0 | - | 0.0-0.0 | - | 0.0 |
| Total | 79 | 22 | 16.6 | 1.8-3.9 | 46.8 | 0.5-1.4 | 39.1 | 1.2-1.6 | 72.8 | 5.4 |
Career Stats - Shooting totals
Career Stats - Shooting per 40 min
| gp | gs | min/g | fg/40 | pct | 3pt/40 | pct | ft/40 | pct | pts/40 | |
|---|---|---|---|---|---|---|---|---|---|---|
| 2012-13 | 23 | 2 | 15.5 | 3.8-8.8 | 43.6 | 1.3-3.5 | 38.7 | 1.7-2.6 | 65.2 | 10.7 |
| 2013-14 | 28 | - | 12.8 | 5.4-11.8 | 45.3 | 1.8-4.4 | 41.0 | 3.9-4.9 | 79.5 | 16.4 |
| 2014-15 | 27 | 20 | 22.0 | 4.2-8.5 | 50.0 | 1.0-2.7 | 37.5 | 2.8-3.9 | 70.7 | 12.3 |
| 2015-16 | 1 | - | 1.0 | 0.0-0.0 | - | 0.0-0.0 | - | 0.0-0.0 | - | 0.0 |
| Total | 79 | 22 | 16.6 | 4.4-9.5 | 46.8 | 1.3-3.4 | 39.1 | 2.8-3.8 | 72.8 | 13.0 |
Career Stats - Ball control per game
| gp | gs | mpg | off/g | def/g | reb/g | pf/g | dq/g | ast/g | to/g | a/to | stl/g | blk/g | |
|---|---|---|---|---|---|---|---|---|---|---|---|---|---|
| 2012-13 | 23 | 2 | 15.5 | 0.8 | 1.5 | 2.3 | 1.4 | 0.0 | 0.5 | 0.7 | 0.7 | 0.6 | 0.4 |
| 2013-14 | 28 | - | 12.8 | 1.1 | 1.3 | 2.4 | 1.7 | 0.0 | 0.4 | 0.8 | 0.5 | 0.3 | 0.3 |
| 2014-15 | 27 | 20 | 22.0 | 1.5 | 2.4 | 3.9 | 1.7 | 0.0 | 0.6 | 1.0 | 0.7 | 0.4 | 0.4 |
| 2015-16 | 1 | - | 1.0 | 0.0 | 1.0 | 1.0 | 0.0 | 0.0 | 0.0 | 0.0 | - | 0.0 | 0.0 |
| Total | 79 | 22 | 16.6 | 1.1 | 1.7 | 2.8 | 1.6 | 0.0 | 0.5 | 0.8 | 0.6 | 0.4 | 0.3 |
Career Stats - Ball control totals
Career Stats - Ball control per 40 min
| gp | gs | mpg | off/40 | def/40 | reb/40 | pf/40 | dq/40 | ast/40 | to/40 | a/to | stl/40 | blk/40 | |
|---|---|---|---|---|---|---|---|---|---|---|---|---|---|
| 2012-13 | 23 | 2 | 15.5 | 2.0 | 3.9 | 6.0 | 3.6 | 0.1 | 1.3 | 1.9 | 0.7 | 1.6 | 1.0 |
| 2013-14 | 28 | - | 12.8 | 3.5 | 3.9 | 7.4 | 5.4 | 0.1 | 1.2 | 2.3 | 0.5 | 0.9 | 0.8 |
| 2014-15 | 27 | 20 | 22.0 | 2.8 | 4.3 | 7.1 | 3.1 | 0.0 | 1.1 | 1.8 | 0.7 | 0.7 | 0.7 |
| 2015-16 | 1 | - | 1.0 | 0.0 | 40.0 | 40.0 | 0.0 | 0.0 | 0.0 | 0.0 | - | 0.0 | 0.0 |
| Total | 79 | 22 | 16.6 | 2.8 | 4.1 | 6.9 | 3.9 | 0.1 | 1.2 | 2.0 | 0.6 | 1.0 | 0.8 |
Splits Stats - Shooting per game
| gp | gs | min/g | fg/g | pct | 3pt/g | pct | ft/g | pct | ppg | ||
|---|---|---|---|---|---|---|---|---|---|---|---|
| Event | Total | 27 | 20 | 22.0 | 2.3-4.7 | 50.0 | 0.6-1.5 | 37.5 | 1.5-2.1 | 70.7 | 6.7 |
| Conference | 21 | 17 | 22.3 | 2.3-4.8 | 47.5 | 0.5-1.5 | 35.5 | 1.5-2.2 | 66.0 | 6.6 | |
| Exhibition | 2 | - | 15.0 | 3.5-6.5 | 53.8 | 1.5-2.5 | 60.0 | 2.5-4.0 | 62.5 | 11.0 | |
| Location | Home | 14 | 9 | 20.8 | 2.0-4.3 | 46.7 | 0.4-1.3 | 33.3 | 1.7-2.3 | 75.0 | 6.1 |
| Away | 13 | 11 | 23.2 | 2.7-5.1 | 53.0 | 0.7-1.7 | 40.9 | 1.3-2.0 | 65.4 | 7.4 | |
| Neutral | - | - | - | 0.0-0.0 | - | 0.0-0.0 | - | 0.0-0.0 | - | - | |
| Result | Wins | 15 | 12 | 21.4 | 2.4-4.3 | 55.4 | 0.6-1.4 | 42.9 | 1.3-1.6 | 79.2 | 6.7 |
| Losses | 12 | 8 | 22.7 | 2.2-5.1 | 44.3 | 0.5-1.6 | 31.6 | 1.8-2.8 | 64.7 | 6.8 | |
| Month | November | 6 | - | 19.3 | 2.3-4.8 | 48.3 | 0.5-1.8 | 27.3 | 2.3-2.8 | 82.4 | 7.5 |
| December | 7 | 6 | 23.6 | 2.6-4.1 | 62.1 | 0.6-1.4 | 40.0 | 1.7-2.1 | 80.0 | 7.4 | |
| January | 7 | 7 | 22.6 | 2.3-4.9 | 47.1 | 0.6-1.3 | 44.4 | 1.0-2.0 | 50.0 | 6.1 | |
| February | 7 | 7 | 22.0 | 2.1-4.9 | 44.1 | 0.6-1.4 | 40.0 | 1.1-1.7 | 66.7 | 6.0 |
Splits Stats - Shooting totals
| gp | gs | min | fg | pct | 3pt | pct | ft | pct | pts | ||
|---|---|---|---|---|---|---|---|---|---|---|---|
| Event | Total | 27 | 20 | 593 | 63-126 | 50.0 | 15-40 | 37.5 | 41-58 | 70.7 | 182 |
| Conference | 21 | 17 | 469 | 48-101 | 47.5 | 11-31 | 35.5 | 31-47 | 66.0 | 138 | |
| Exhibition | 2 | - | 30 | 7-13 | 53.8 | 3-5 | 60.0 | 5-8 | 62.5 | 22 | |
| Location | Home | 14 | 9 | 291 | 28-60 | 46.7 | 6-18 | 33.3 | 24-32 | 75.0 | 86 |
| Away | 13 | 11 | 302 | 35-66 | 53.0 | 9-22 | 40.9 | 17-26 | 65.4 | 96 | |
| Neutral | - | - | - | 0-0 | - | 0-0 | - | 0-0 | - | 0 | |
| Result | Wins | 15 | 12 | 321 | 36-65 | 55.4 | 9-21 | 42.9 | 19-24 | 79.2 | 100 |
| Losses | 12 | 8 | 272 | 27-61 | 44.3 | 6-19 | 31.6 | 22-34 | 64.7 | 82 | |
| Month | November | 6 | - | 116 | 14-29 | 48.3 | 3-11 | 27.3 | 14-17 | 82.4 | 45 |
| December | 7 | 6 | 165 | 18-29 | 62.1 | 4-10 | 40.0 | 12-15 | 80.0 | 52 | |
| January | 7 | 7 | 158 | 16-34 | 47.1 | 4-9 | 44.4 | 7-14 | 50.0 | 43 | |
| February | 7 | 7 | 154 | 15-34 | 44.1 | 4-10 | 40.0 | 8-12 | 66.7 | 42 |
Splits Stats - Shooting per 40 min
| gp | gs | min/g | fg/40 | pct | 3pt/40 | pct | ft/40 | pct | pts/40 | ||
|---|---|---|---|---|---|---|---|---|---|---|---|
| Event | Total | 27 | 20 | 22.0 | 4.2-8.5 | 50.0 | 1.0-2.7 | 37.5 | 2.8-3.9 | 70.7 | 12.3 |
| Conference | 21 | 17 | 22.3 | 4.1-8.6 | 47.5 | 0.9-2.6 | 35.5 | 2.6-4.0 | 66.0 | 11.8 | |
| Exhibition | 2 | - | 15.0 | 9.3-17.3 | 53.8 | 4.0-6.7 | 60.0 | 6.7-10.7 | 62.5 | 29.3 | |
| Location | Home | 14 | 9 | 20.8 | 3.8-8.2 | 46.7 | 0.8-2.5 | 33.3 | 3.3-4.4 | 75.0 | 11.8 |
| Away | 13 | 11 | 23.2 | 4.6-8.7 | 53.0 | 1.2-2.9 | 40.9 | 2.3-3.4 | 65.4 | 12.7 | |
| Neutral | - | - | - | 0.0-0.0 | - | 0.0-0.0 | - | 0.0-0.0 | - | - | |
| Result | Wins | 15 | 12 | 21.4 | 4.5-8.1 | 55.4 | 1.1-2.6 | 42.9 | 2.4-3.0 | 79.2 | 12.5 |
| Losses | 12 | 8 | 22.7 | 4.0-9.0 | 44.3 | 0.9-2.8 | 31.6 | 3.2-5.0 | 64.7 | 12.1 | |
| Month | November | 6 | - | 19.3 | 4.8-10.0 | 48.3 | 1.0-3.8 | 27.3 | 4.8-5.9 | 82.4 | 15.5 |
| December | 7 | 6 | 23.6 | 4.4-7.0 | 62.1 | 1.0-2.4 | 40.0 | 2.9-3.6 | 80.0 | 12.6 | |
| January | 7 | 7 | 22.6 | 4.1-8.6 | 47.1 | 1.0-2.3 | 44.4 | 1.8-3.5 | 50.0 | 10.9 | |
| February | 7 | 7 | 22.0 | 3.9-8.8 | 44.1 | 1.0-2.6 | 40.0 | 2.1-3.1 | 66.7 | 10.9 |
Splits Stats - Ball control per game
| gp | gs | mpg | off/g | def/g | reb/g | pf/g | dq/g | ast/g | to/g | a/to | stl/g | blk/g | ||
|---|---|---|---|---|---|---|---|---|---|---|---|---|---|---|
| Event | Total | 27 | 20 | 22.0 | 1.5 | 2.4 | 3.9 | 1.7 | 0.0 | 0.6 | 1.0 | 0.7 | 0.4 | 0.4 |
| Conference | 21 | 17 | 22.3 | 1.7 | 2.6 | 4.2 | 1.7 | 0.0 | 0.7 | 0.9 | 0.8 | 0.3 | 0.5 | |
| Exhibition | 2 | - | 15.0 | 1.5 | 2.0 | 3.5 | 2.0 | 0.0 | 1.0 | 0.5 | 2.0 | 2.0 | 0.5 | |
| Location | Home | 14 | 9 | 20.8 | 1.1 | 2.4 | 3.4 | 1.6 | 0.0 | 1.0 | 0.6 | 1.6 | 0.3 | 0.6 |
| Away | 13 | 11 | 23.2 | 2.0 | 2.4 | 4.4 | 1.8 | 0.0 | 0.2 | 1.3 | 0.2 | 0.5 | 0.2 | |
| Neutral | - | - | - | - | - | - | - | - | - | - | - | - | - | |
| Result | Wins | 15 | 12 | 21.4 | 1.3 | 2.7 | 3.9 | 1.4 | 0.0 | 0.7 | 1.0 | 0.7 | 0.4 | 0.5 |
| Losses | 12 | 8 | 22.7 | 1.8 | 2.0 | 3.8 | 2.1 | 0.0 | 0.6 | 0.9 | 0.6 | 0.3 | 0.3 | |
| Month | November | 6 | - | 19.3 | 1.7 | 1.7 | 3.3 | 2.3 | 0.0 | 1.0 | 0.3 | 3.0 | 0.5 | 0.3 |
| December | 7 | 6 | 23.6 | 1.3 | 2.6 | 3.9 | 2.3 | 0.0 | 0.4 | 1.9 | 0.2 | 0.4 | 0.4 | |
| January | 7 | 7 | 22.6 | 1.9 | 3.0 | 4.9 | 1.0 | 0.0 | 0.6 | 0.6 | 1.0 | 0.4 | 0.7 | |
| February | 7 | 7 | 22.0 | 1.3 | 2.1 | 3.4 | 1.3 | 0.0 | 0.6 | 1.0 | 0.6 | 0.1 | 0.1 |
Splits Stats - Ball control totals
| gp | gs | min | off | def | reb | pf | dq | ast | to | a/to | stl | blk | ||
|---|---|---|---|---|---|---|---|---|---|---|---|---|---|---|
| Event | Total | 27 | 20 | 593 | 41 | 64 | 105 | 46 | 0 | 17 | 26 | 0.7 | 10 | 11 |
| Conference | 21 | 17 | 469 | 35 | 54 | 89 | 35 | 0 | 15 | 19 | 0.8 | 7 | 11 | |
| Exhibition | 2 | - | 30 | 3 | 4 | 7 | 4 | 0 | 2 | 1 | 2.0 | 4 | 1 | |
| Location | Home | 14 | 9 | 291 | 15 | 33 | 48 | 22 | 0 | 14 | 9 | 1.6 | 4 | 8 |
| Away | 13 | 11 | 302 | 26 | 31 | 57 | 24 | 0 | 3 | 17 | 0.2 | 6 | 3 | |
| Neutral | - | - | - | - | - | - | - | - | - | - | - | - | - | |
| Result | Wins | 15 | 12 | 321 | 19 | 40 | 59 | 21 | 0 | 10 | 15 | 0.7 | 6 | 8 |
| Losses | 12 | 8 | 272 | 22 | 24 | 46 | 25 | 0 | 7 | 11 | 0.6 | 4 | 3 | |
| Month | November | 6 | - | 116 | 10 | 10 | 20 | 14 | 0 | 6 | 2 | 3.0 | 3 | 2 |
| December | 7 | 6 | 165 | 9 | 18 | 27 | 16 | 0 | 3 | 13 | 0.2 | 3 | 3 | |
| January | 7 | 7 | 158 | 13 | 21 | 34 | 7 | 0 | 4 | 4 | 1.0 | 3 | 5 | |
| February | 7 | 7 | 154 | 9 | 15 | 24 | 9 | 0 | 4 | 7 | 0.6 | 1 | 1 |
Splits Stats - Ball control per 40 min
| gp | gs | mpg | off/40 | def/40 | reb/40 | pf/40 | dq/40 | ast/40 | to/40 | a/to | stl/40 | blk/40 | ||
|---|---|---|---|---|---|---|---|---|---|---|---|---|---|---|
| Event | Total | 27 | 20 | 22.0 | 2.8 | 4.3 | 7.1 | 3.1 | 0.0 | 1.1 | 1.8 | 0.7 | 0.7 | 0.7 |
| Conference | 21 | 17 | 22.3 | 3.0 | 4.6 | 7.6 | 3.0 | 0.0 | 1.3 | 1.6 | 0.8 | 0.6 | 0.9 | |
| Exhibition | 2 | - | 15.0 | 4.0 | 5.3 | 9.3 | 5.3 | 0.0 | 2.7 | 1.3 | 2.0 | 5.3 | 1.3 | |
| Location | Home | 14 | 9 | 20.8 | 2.1 | 4.5 | 6.6 | 3.0 | 0.0 | 1.9 | 1.2 | 1.6 | 0.5 | 1.1 |
| Away | 13 | 11 | 23.2 | 3.4 | 4.1 | 7.5 | 3.2 | 0.0 | 0.4 | 2.3 | 0.2 | 0.8 | 0.4 | |
| Neutral | - | - | - | - | - | - | - | - | - | - | - | - | - | |
| Result | Wins | 15 | 12 | 21.4 | 2.4 | 5.0 | 7.4 | 2.6 | 0.0 | 1.2 | 1.9 | 0.7 | 0.7 | 1.0 |
| Losses | 12 | 8 | 22.7 | 3.2 | 3.5 | 6.8 | 3.7 | 0.0 | 1.0 | 1.6 | 0.6 | 0.6 | 0.4 | |
| Month | November | 6 | - | 19.3 | 3.4 | 3.4 | 6.9 | 4.8 | 0.0 | 2.1 | 0.7 | 3.0 | 1.0 | 0.7 |
| December | 7 | 6 | 23.6 | 2.2 | 4.4 | 6.5 | 3.9 | 0.0 | 0.7 | 3.2 | 0.2 | 0.7 | 0.7 | |
| January | 7 | 7 | 22.6 | 3.3 | 5.3 | 8.6 | 1.8 | 0.0 | 1.0 | 1.0 | 1.0 | 0.8 | 1.3 | |
| February | 7 | 7 | 22.0 | 2.3 | 3.9 | 6.2 | 2.3 | 0.0 | 1.0 | 1.8 | 0.6 | 0.3 | 0.3 |