
-
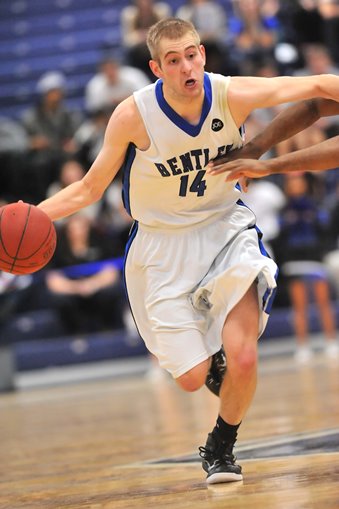
- Height:
- 6-6
-
- Weight:
- 190
-
- Year:
- Jr.
-
- Hometown:
- Wells, Maine
-
- High School:
- Wells/Cushing Academy
-
- Position:
- G
-
- Mile Time:
- 5:41
-
- gp
- 21
-
- pts/g
- 9.3
-
- fg %
- 45.8
-
- 3pt %
- 33.8
-
- ft %
- 77.8
-
- reb/g
- 3.6
-
- a/g
- 3.5
Bio
Career Notes
Career averages of 8.6 points, 3.9 rebounds and 3.0 assists in 76 games (59 starts) … appeared in every game during his first two seasons before missing six due to injury last winter … impressive 2.38 assist-turnover ratio over the last two seasons … career totals include 655 points, 299 rebounds and 232 assists with a .479 field goal percentage.
2014-15 Season
Appeared in 21 games, with 20 starts, and averaged 9.3 points, 3.6 rebounds and 3.5 assists … missed six games with a shoulder injury from Nov. 19-Dec. 6 with the Falcons 13-7 when he was available to play at least 20 minutes … finished season ranked third in the Northeast-10 in assist-turnover ratio (2.1) and 13th in assists … was also 66th in Division II nationally in assist-turnover ratio … established career-bests in minutes per game (30.9) … scored in doubles eight times with a high of 23, on 9-of-11 shooting, Jan. 31 against Pace … also had 18 points against St. Michael’s Feb. 14, a game in which he buried five of seven three-pointers, and 17 vs. Saint Anselm Jan. 3 … Bentley was 6-2 when he had at least four assists and 5-1 when he took at least four free throws … in home games, shot .569 overall and .444 from three while averaging 10.8 points … knocked down five three-pointers twice (Jan. 31 vs. Pace, Feb. 14 vs. St. Michael’s), making 10 of 13 from deep in those two games … named to Northeast-10 Weekly Honor Roll Feb. 2.
2013-14 Season
Started all 29 games and averaged 10.1 points, 4.5 rebounds and 4.2 assists … shot .517 overall, made .449 from three-point land and shot .818 from the line … one of two NE-10 players to shoot at least .500 overall, .400 from three and .800 free throw, a distinction he shared with teammate Tyler McFarland … one of three NE-10 players who averaged at least 10 points, four rebounds and four assists (Nate Champion, Le Moyne, and Tylon Smith, Southern Connecticut) … scored in doubles 17 times with a pair of 20-point games (27 vs. Assumption Nov. 20, 20 vs. Southern New Hampshire six days later) … five or more assists 13 times, with a high of nine Feb. 25 against Franklin Pierce … nine or more rebounds three times, including 10 at American International Jan. 18 … was second on the team in defensive rebounds (120) … hit 13-footer in lane with 2.4 seconds left to give Bentley 95-94 win over Merrimack Feb. 11 … made at least 80 percent of his shots four times, including 10-12 against Assumption Nov. 20 and 7-8 at New Haven Jan. 22 … in the Northeast-10, was third in assist-turnover ratio (2.6), fifth in three-point accuracy, sixth in total assists (122), eighth in assists per game and 12th in field goal percentage … was 36th in Division II nationally in assist-turnover ratio and was 90th in assists … Northeast-10 Weekly Honor Roll three times (Nov. 25, Dec. 2, Jan. 27).
2012-13 Season
Saw action in all 26 games as a freshman, and averaged 6.4 points and 3.6 rebounds while playing 21.7 minutes a game … shot .448 from the field and connected 18 times from outside the arc … was fifth on team in scoring and rebounds, as well as minutes played … broke in with a bang, exploding for 24 points on 10-of-12 shooting in a 78-71 win over Caldwell Nov. 9 … also had a career-best eight rebounds that night in his career debut … scored 17 points without missing a shot against Le Moyne Jan 29, a performance that included a perfect 5-for-5 from three-point land … scored in doubles a total of five times … had 5+ rebounds seven times and three games with four assists.
Before Bentley
2011 graduate of Wells High School who prepped at Cushing Academy along with current teammate Tyler McFarland … helped Cheverus High School to the 2009 Maine Class A state championship before transferring to Wells for his senior year … earned All-State honors as a senior … selected for Maine McDonald’s Senior All-Star Game … semifinalist for Mr. Maine Basketball in 2011 … also played for the MB Nation Basketball Club, which won the 18 and under national championship in 2011
Personal
Is majoring in management … age as of Nov. 15, 2014: 21 … son of James and Colleen Furness … has two sisters, Alison (18) and Anna (16).
Player Profile
| Overall | Conf | |||
|---|---|---|---|---|
| Games | 21 | 16 | ||
| Games started | 20 | 16 | ||
| Minutes | 647 | 521 | ||
| Minutes per game | 30.8 | 32.6 | ||
| FG | 66-144 | 57-122 | ||
| FG Pct | 45.8 | 46.7 | ||
| 3PT | 22-65 | 19-55 | ||
| 3PT Pct | 33.8 | 34.5 | ||
| FT | 42-54 | 33-41 | ||
| FT Pct | 77.8 | 80.5 | ||
| Off rebounds | 11 | 11 | ||
| Def rebounds | 64 | 48 | ||
| Total rebounds | 75 | 59 | ||
| Rebounds per game | 3.6 | 3.7 | ||
| Personal fouls | 24 | 18 | ||
| Disqualifications | 0 | 0 | ||
| Assists | 74 | 59 | ||
| Turnovers | 35 | 30 | ||
| Assist to turnover ratio | 2.1 | 2.0 | ||
| Steals | 14 | 10 | ||
| Blocks | 8 | 7 | ||
| Points | 196 | 166 | ||
| Points per game | 9.3 | 10.4 | ||
| Points per 40 min | 12.1 | 12.7 | ||
Game Log - Shooting
| Date | Opponent | Score | gs | min | fg | pct | 3pt | pct | ft | pct | pts |
|---|---|---|---|---|---|---|---|---|---|---|---|
| Oct 31 | St. Mary's (Canada) | W, 121-70 | 1 | 21 | 4-7 | 57.1 | 1-2 | 50.0 | 0-0 | - | 9 |
| Nov 1 | St. Francis Xavier (Canada) | W, 103-59 | 1 | 24 | 2-5 | 40.0 | 1-2 | 50.0 | 6-6 | 100.0 | 11 |
| Nov 14 | Philadelphia U. | W, 72-63 | 1 | 30 | 3-10 | 30.0 | 1-5 | 20.0 | 1-2 | 50.0 | 8 |
| Nov 15 | Holy Family | L, 68-67 | 1 | 2 | 0-0 | - | 0-0 | - | 0-0 | - | 0 |
| Nov 19 | at Assumption | L, 81-74 | - | - | - | - | - | - | - | - | - |
| Nov 22 | Stonehill | L, 90-85 | - | - | - | - | - | - | - | - | - |
| Nov 25 | at Southern N.H. | L, 74-67 | - | - | - | - | - | - | - | - | - |
| Nov 30 | Bridgeport | W, 104-57 | - | - | - | - | - | - | - | - | - |
| Dec 3 | Merrimack | W, 86-79 | - | - | - | - | - | - | - | - | - |
| Dec 6 | at St. Michael's | L, 95-87 | - | - | - | - | - | - | - | - | - |
| Dec 9 | at Molloy | W, 99-92 | - | 26 | 4-8 | 50.0 | 0-2 | 0.0 | 6-8 | 75.0 | 14 |
| Dec 14 | Le Moyne | W, 73-67 | 1 | 33 | 2-2 | 100.0 | 0-0 | - | 2-2 | 100.0 | 6 |
| Dec 19 | at Caldwell | W, 80-70 | 1 | 36 | 1-2 | 50.0 | 1-1 | 100.0 | 0-0 | - | 3 |
| Dec 21 | at New Haven | W, 74-63 | 1 | 32 | 1-2 | 50.0 | 1-2 | 50.0 | 2-3 | 66.7 | 5 |
| Dec 31 | Franklin Pierce | W, 84-68 | 1 | 34 | 3-6 | 50.0 | 1-3 | 33.3 | 0-0 | - | 7 |
| Jan 3 | Saint Anselm | W, 79-72 | 1 | 31 | 4-7 | 57.1 | 0-1 | 0.0 | 9-10 | 90.0 | 17 |
| Jan 10 | at Southern Conn. St. | L, 89-77 | 1 | 28 | 3-7 | 42.9 | 0-1 | 0.0 | 0-0 | - | 6 |
| Jan 14 | at Adelphi | W, 75-67 | 1 | 35 | 3-9 | 33.3 | 2-4 | 50.0 | 6-8 | 75.0 | 14 |
| Jan 17 | American Int'l | L, 84-77 | 1 | 35 | 2-3 | 66.7 | 0-1 | 0.0 | 2-2 | 100.0 | 6 |
| Jan 21 | New Haven | W, 65-56 | 1 | 27 | 4-9 | 44.4 | 3-7 | 42.9 | 2-4 | 50.0 | 13 |
| Jan 29 | at Saint Rose | W, 87-69 | 1 | 33 | 4-7 | 57.1 | 2-3 | 66.7 | 0-0 | - | 10 |
| Jan 31 | Pace | W, 75-53 | 1 | 31 | 9-11 | 81.8 | 5-6 | 83.3 | 0-1 | 0.0 | 23 |
| Feb 4 | Assumption | W, 81-80 | 1 | 34 | 5-9 | 55.6 | 0-3 | 0.0 | 4-4 | 100.0 | 14 |
| Feb 7 | at Saint Anselm | L, 80-59 | 1 | 33 | 4-11 | 36.4 | 0-3 | 0.0 | 0-0 | - | 8 |
| Feb 10 | at Merrimack | L, 78-61 | 1 | 31 | 3-10 | 30.0 | 0-6 | 0.0 | 0-0 | - | 6 |
| Feb 14 | St. Michael's | W, 77-76 | 1 | 36 | 6-9 | 66.7 | 5-7 | 71.4 | 1-1 | 100.0 | 18 |
| Feb 18 | Southern N.H. | L, 85-73 | 1 | 34 | 3-6 | 50.0 | 1-3 | 33.3 | 0-1 | 0.0 | 7 |
| Feb 21 | at Stonehill | L, 73-72 | 1 | 31 | 1-12 | 8.3 | 0-5 | 0.0 | 0-0 | - | 2 |
| Feb 24 | at Franklin Pierce | L, 85-84 | 1 | 35 | 1-4 | 25.0 | 0-2 | 0.0 | 7-8 | 87.5 | 9 |
Game Log - Ball control
| Date | Opponent | Score | gs | min | off | def | reb | ast | to | a/to | stl | blk | pf | dq |
|---|---|---|---|---|---|---|---|---|---|---|---|---|---|---|
| Oct 31 | St. Mary's (Canada) | W, 121-70 | 1 | 21 | 0 | 4 | 4 | 7 | 1 | 7.0 | 0 | 0 | 1 | 0 |
| Nov 1 | St. Francis Xavier (Canada) | W, 103-59 | 1 | 24 | 0 | 1 | 1 | 3 | 1 | 3.0 | 1 | 0 | 0 | 0 |
| Nov 14 | Philadelphia U. | W, 72-63 | 1 | 30 | 0 | 3 | 3 | 3 | 1 | 3.0 | 0 | 0 | 2 | 0 |
| Nov 15 | Holy Family | L, 68-67 | 1 | 2 | 0 | 0 | 0 | 0 | 0 | - | 0 | 0 | 0 | 0 |
| Nov 19 | at Assumption | L, 81-74 | - | - | - | - | - | - | - | - | - | - | - | - |
| Nov 22 | Stonehill | L, 90-85 | - | - | - | - | - | - | - | - | - | - | - | - |
| Nov 25 | at Southern N.H. | L, 74-67 | - | - | - | - | - | - | - | - | - | - | - | - |
| Nov 30 | Bridgeport | W, 104-57 | - | - | - | - | - | - | - | - | - | - | - | - |
| Dec 3 | Merrimack | W, 86-79 | - | - | - | - | - | - | - | - | - | - | - | - |
| Dec 6 | at St. Michael's | L, 95-87 | - | - | - | - | - | - | - | - | - | - | - | - |
| Dec 9 | at Molloy | W, 99-92 | - | 26 | 0 | 3 | 3 | 3 | 2 | 1.5 | 3 | 1 | 3 | - |
| Dec 14 | Le Moyne | W, 73-67 | 1 | 33 | 0 | 0 | 0 | 4 | 1 | 4.0 | 0 | 1 | 0 | 0 |
| Dec 19 | at Caldwell | W, 80-70 | 1 | 36 | 0 | 7 | 7 | 4 | 1 | 4.0 | 0 | 0 | 0 | - |
| Dec 21 | at New Haven | W, 74-63 | 1 | 32 | 0 | 3 | 3 | 5 | 1 | 5.0 | 1 | 0 | 1 | 0 |
| Dec 31 | Franklin Pierce | W, 84-68 | 1 | 34 | 0 | 7 | 7 | 8 | 2 | 4.0 | 0 | 1 | 0 | 0 |
| Jan 3 | Saint Anselm | W, 79-72 | 1 | 31 | 0 | 2 | 2 | 2 | 3 | 0.7 | 1 | 0 | 0 | 0 |
| Jan 10 | at Southern Conn. St. | L, 89-77 | 1 | 28 | 2 | 4 | 6 | 3 | 3 | 1.0 | 0 | 1 | 2 | 0 |
| Jan 14 | at Adelphi | W, 75-67 | 1 | 35 | 1 | 3 | 4 | 3 | 1 | 3.0 | 1 | 0 | 3 | 0 |
| Jan 17 | American Int'l | L, 84-77 | 1 | 35 | 0 | 4 | 4 | 3 | 5 | 0.6 | 1 | 0 | 2 | 0 |
| Jan 21 | New Haven | W, 65-56 | 1 | 27 | 1 | 0 | 1 | 1 | 2 | 0.5 | 0 | 0 | 0 | 0 |
| Jan 29 | at Saint Rose | W, 87-69 | 1 | 33 | 0 | 3 | 3 | 3 | 4 | 0.8 | 0 | 0 | 1 | 0 |
| Jan 31 | Pace | W, 75-53 | 1 | 31 | 1 | 3 | 4 | 3 | 0 | - | 1 | 1 | 2 | 0 |
| Feb 4 | Assumption | W, 81-80 | 1 | 34 | 1 | 1 | 2 | 6 | 1 | 6.0 | 2 | 0 | 2 | 0 |
| Feb 7 | at Saint Anselm | L, 80-59 | 1 | 33 | 2 | 4 | 6 | 3 | 0 | - | 1 | 0 | 0 | 0 |
| Feb 10 | at Merrimack | L, 78-61 | 1 | 31 | 0 | 5 | 5 | 3 | 1 | 3.0 | 1 | 1 | 0 | 0 |
| Feb 14 | St. Michael's | W, 77-76 | 1 | 36 | 0 | 0 | 0 | 7 | 2 | 3.5 | 1 | 1 | 0 | 0 |
| Feb 18 | Southern N.H. | L, 85-73 | 1 | 34 | 1 | 8 | 9 | 4 | 2 | 2.0 | 0 | 1 | 3 | 0 |
| Feb 21 | at Stonehill | L, 73-72 | 1 | 31 | 1 | 2 | 3 | 1 | 2 | 0.5 | 1 | 0 | 2 | - |
| Feb 24 | at Franklin Pierce | L, 85-84 | 1 | 35 | 1 | 2 | 3 | 5 | 1 | 5.0 | 0 | 0 | 1 | 0 |
Career Stats - Shooting per game
| gp | gs | min/g | fg/g | pct | 3pt/g | pct | ft/g | pct | ppg | |
|---|---|---|---|---|---|---|---|---|---|---|
| 2012-13 | 26 | 10 | 21.7 | 2.7-5.9 | 44.8 | 0.7-2.2 | 32.1 | 0.4-0.8 | 52.4 | 6.4 |
| 2013-14 | 29 | 29 | 28.3 | 3.7-7.2 | 51.7 | 1.1-2.4 | 44.9 | 1.6-1.9 | 81.8 | 10.1 |
| 2014-15 | 21 | 20 | 30.8 | 3.1-6.9 | 45.8 | 1.0-3.1 | 33.8 | 2.0-2.6 | 77.8 | 9.3 |
| 2015-16 | 30 | 30 | 33.5 | 4.7-9.8 | 48.5 | 2.7-5.8 | 46.0 | 1.8-2.0 | 91.7 | 14.0 |
| Total | 106 | 89 | 28.7 | 3.6-7.5 | 48.1 | 1.4-3.4 | 41.5 | 1.4-1.8 | 80.5 | 10.1 |
Career Stats - Shooting totals
| gp | gs | min | fg | pct | 3pt | pct | ft | pct | pts | |
|---|---|---|---|---|---|---|---|---|---|---|
| 2012-13 | 26 | 10 | 564 | 69-154 | 44.8 | 18-56 | 32.1 | 11-21 | 52.4 | 167 |
| 2013-14 | 29 | 29 | 822 | 108-209 | 51.7 | 31-69 | 44.9 | 45-55 | 81.8 | 292 |
| 2014-15 | 21 | 20 | 647 | 66-144 | 45.8 | 22-65 | 33.8 | 42-54 | 77.8 | 196 |
| 2015-16 | 30 | 30 | 1005 | 142-293 | 48.5 | 80-174 | 46.0 | 55-60 | 91.7 | 419 |
| Total | 106 | 89 | 3038 | 385-800 | 48.1 | 151-364 | 41.5 | 153-190 | 80.5 | 1074 |
Career Stats - Shooting per 40 min
| gp | gs | min/g | fg/40 | pct | 3pt/40 | pct | ft/40 | pct | pts/40 | |
|---|---|---|---|---|---|---|---|---|---|---|
| 2012-13 | 26 | 10 | 21.7 | 4.9-10.9 | 44.8 | 1.3-4.0 | 32.1 | 0.8-1.5 | 52.4 | 11.8 |
| 2013-14 | 29 | 29 | 28.3 | 5.3-10.2 | 51.7 | 1.5-3.4 | 44.9 | 2.2-2.7 | 81.8 | 14.2 |
| 2014-15 | 21 | 20 | 30.8 | 4.1-8.9 | 45.8 | 1.4-4.0 | 33.8 | 2.6-3.3 | 77.8 | 12.1 |
| 2015-16 | 30 | 30 | 33.5 | 5.7-11.7 | 48.5 | 3.2-6.9 | 46.0 | 2.2-2.4 | 91.7 | 16.7 |
| Total | 106 | 89 | 28.7 | 5.1-10.5 | 48.1 | 2.0-4.8 | 41.5 | 2.0-2.5 | 80.5 | 14.1 |
Career Stats - Ball control per game
| gp | gs | mpg | off/g | def/g | reb/g | pf/g | dq/g | ast/g | to/g | a/to | stl/g | blk/g | |
|---|---|---|---|---|---|---|---|---|---|---|---|---|---|
| 2012-13 | 26 | 10 | 21.7 | 0.8 | 2.7 | 3.6 | 0.9 | 0.0 | 1.4 | 1.7 | 0.8 | 0.6 | 0.3 |
| 2013-14 | 29 | 29 | 28.3 | 0.4 | 4.1 | 4.5 | 1.0 | 0.0 | 4.2 | 1.6 | 2.6 | 0.6 | 0.2 |
| 2014-15 | 21 | 20 | 30.8 | 0.5 | 3.0 | 3.6 | 1.1 | 0.0 | 3.5 | 1.7 | 2.1 | 0.7 | 0.4 |
| 2015-16 | 30 | 30 | 33.5 | 1.1 | 3.9 | 5.0 | 1.3 | 0.0 | 2.8 | 1.2 | 2.2 | 0.5 | 0.2 |
| Total | 106 | 89 | 28.7 | 0.7 | 3.5 | 4.2 | 1.1 | 0.0 | 3.0 | 1.5 | 1.9 | 0.6 | 0.3 |
Career Stats - Ball control totals
Career Stats - Ball control per 40 min
| gp | gs | mpg | off/40 | def/40 | reb/40 | pf/40 | dq/40 | ast/40 | to/40 | a/to | stl/40 | blk/40 | |
|---|---|---|---|---|---|---|---|---|---|---|---|---|---|
| 2012-13 | 26 | 10 | 21.7 | 1.6 | 5.0 | 6.6 | 1.7 | 0.0 | 2.6 | 3.1 | 0.8 | 1.1 | 0.6 |
| 2013-14 | 29 | 29 | 28.3 | 0.5 | 5.8 | 6.4 | 1.4 | 0.0 | 5.9 | 2.3 | 2.6 | 0.8 | 0.2 |
| 2014-15 | 21 | 20 | 30.8 | 0.7 | 4.0 | 4.6 | 1.5 | 0.0 | 4.6 | 2.2 | 2.1 | 0.9 | 0.5 |
| 2015-16 | 30 | 30 | 33.5 | 1.3 | 4.7 | 5.9 | 1.5 | 0.0 | 3.3 | 1.5 | 2.2 | 0.6 | 0.2 |
| Total | 106 | 89 | 28.7 | 1.0 | 4.9 | 5.9 | 1.5 | 0.0 | 4.2 | 2.1 | 1.9 | 0.8 | 0.4 |
Splits Stats - Shooting per game
| gp | gs | min/g | fg/g | pct | 3pt/g | pct | ft/g | pct | ppg | ||
|---|---|---|---|---|---|---|---|---|---|---|---|
| Event | Total | 21 | 20 | 30.8 | 3.1-6.9 | 45.8 | 1.0-3.1 | 33.8 | 2.0-2.6 | 77.8 | 9.3 |
| Conference | 16 | 16 | 32.6 | 3.6-7.6 | 46.7 | 1.2-3.4 | 34.5 | 2.1-2.6 | 80.5 | 10.4 | |
| Exhibition | 2 | 2 | 22.5 | 3.0-6.0 | 50.0 | 1.0-2.0 | 50.0 | 3.0-3.0 | 100.0 | 10.0 | |
| Location | Home | 11 | 11 | 29.7 | 3.7-6.5 | 56.9 | 1.5-3.3 | 44.4 | 1.9-2.5 | 77.8 | 10.8 |
| Away | 10 | 9 | 32.0 | 2.5-7.2 | 34.7 | 0.6-2.9 | 20.7 | 2.1-2.7 | 77.8 | 7.7 | |
| Neutral | - | - | - | 0.0-0.0 | - | 0.0-0.0 | - | 0.0-0.0 | - | - | |
| Result | Wins | 13 | 12 | 32.2 | 3.8-7.0 | 53.8 | 1.6-3.4 | 47.7 | 2.5-3.3 | 76.7 | 11.7 |
| Losses | 8 | 8 | 28.6 | 2.1-6.6 | 32.1 | 0.1-2.6 | 4.8 | 1.1-1.4 | 81.8 | 5.5 | |
| Month | November | 2 | 2 | 16.0 | 1.5-5.0 | 30.0 | 0.5-2.5 | 20.0 | 0.5-1.0 | 50.0 | 4.0 |
| December | 5 | 4 | 32.2 | 2.2-4.0 | 55.0 | 0.6-1.6 | 37.5 | 2.0-2.6 | 76.9 | 7.0 | |
| January | 7 | 7 | 31.4 | 4.1-7.6 | 54.7 | 1.7-3.3 | 52.2 | 2.7-3.6 | 76.0 | 12.7 | |
| February | 7 | 7 | 33.4 | 3.3-8.7 | 37.7 | 0.9-4.1 | 20.7 | 1.7-2.0 | 85.7 | 9.1 |
Splits Stats - Shooting totals
| gp | gs | min | fg | pct | 3pt | pct | ft | pct | pts | ||
|---|---|---|---|---|---|---|---|---|---|---|---|
| Event | Total | 21 | 20 | 647 | 66-144 | 45.8 | 22-65 | 33.8 | 42-54 | 77.8 | 196 |
| Conference | 16 | 16 | 521 | 57-122 | 46.7 | 19-55 | 34.5 | 33-41 | 80.5 | 166 | |
| Exhibition | 2 | 2 | 45 | 6-12 | 50.0 | 2-4 | 50.0 | 6-6 | 100.0 | 20 | |
| Location | Home | 11 | 11 | 327 | 41-72 | 56.9 | 16-36 | 44.4 | 21-27 | 77.8 | 119 |
| Away | 10 | 9 | 320 | 25-72 | 34.7 | 6-29 | 20.7 | 21-27 | 77.8 | 77 | |
| Neutral | - | - | - | 0-0 | - | 0-0 | - | 0-0 | - | 0 | |
| Result | Wins | 13 | 12 | 418 | 49-91 | 53.8 | 21-44 | 47.7 | 33-43 | 76.7 | 152 |
| Losses | 8 | 8 | 229 | 17-53 | 32.1 | 1-21 | 4.8 | 9-11 | 81.8 | 44 | |
| Month | November | 2 | 2 | 32 | 3-10 | 30.0 | 1-5 | 20.0 | 1-2 | 50.0 | 8 |
| December | 5 | 4 | 161 | 11-20 | 55.0 | 3-8 | 37.5 | 10-13 | 76.9 | 35 | |
| January | 7 | 7 | 220 | 29-53 | 54.7 | 12-23 | 52.2 | 19-25 | 76.0 | 89 | |
| February | 7 | 7 | 234 | 23-61 | 37.7 | 6-29 | 20.7 | 12-14 | 85.7 | 64 |
Splits Stats - Shooting per 40 min
| gp | gs | min/g | fg/40 | pct | 3pt/40 | pct | ft/40 | pct | pts/40 | ||
|---|---|---|---|---|---|---|---|---|---|---|---|
| Event | Total | 21 | 20 | 30.8 | 4.1-8.9 | 45.8 | 1.4-4.0 | 33.8 | 2.6-3.3 | 77.8 | 12.1 |
| Conference | 16 | 16 | 32.6 | 4.4-9.4 | 46.7 | 1.5-4.2 | 34.5 | 2.5-3.1 | 80.5 | 12.7 | |
| Exhibition | 2 | 2 | 22.5 | 5.3-10.7 | 50.0 | 1.8-3.6 | 50.0 | 5.3-5.3 | 100.0 | 17.8 | |
| Location | Home | 11 | 11 | 29.7 | 5.0-8.8 | 56.9 | 2.0-4.4 | 44.4 | 2.6-3.3 | 77.8 | 14.6 |
| Away | 10 | 9 | 32.0 | 3.1-9.0 | 34.7 | 0.8-3.6 | 20.7 | 2.6-3.4 | 77.8 | 9.6 | |
| Neutral | - | - | - | 0.0-0.0 | - | 0.0-0.0 | - | 0.0-0.0 | - | - | |
| Result | Wins | 13 | 12 | 32.2 | 4.7-8.7 | 53.8 | 2.0-4.2 | 47.7 | 3.2-4.1 | 76.7 | 14.5 |
| Losses | 8 | 8 | 28.6 | 3.0-9.3 | 32.1 | 0.2-3.7 | 4.8 | 1.6-1.9 | 81.8 | 7.7 | |
| Month | November | 2 | 2 | 16.0 | 3.8-12.5 | 30.0 | 1.2-6.2 | 20.0 | 1.2-2.5 | 50.0 | 10.0 |
| December | 5 | 4 | 32.2 | 2.7-5.0 | 55.0 | 0.7-2.0 | 37.5 | 2.5-3.2 | 76.9 | 8.7 | |
| January | 7 | 7 | 31.4 | 5.3-9.6 | 54.7 | 2.2-4.2 | 52.2 | 3.5-4.5 | 76.0 | 16.2 | |
| February | 7 | 7 | 33.4 | 3.9-10.4 | 37.7 | 1.0-5.0 | 20.7 | 2.1-2.4 | 85.7 | 10.9 |
Splits Stats - Ball control per game
| gp | gs | mpg | off/g | def/g | reb/g | pf/g | dq/g | ast/g | to/g | a/to | stl/g | blk/g | ||
|---|---|---|---|---|---|---|---|---|---|---|---|---|---|---|
| Event | Total | 21 | 20 | 30.8 | 0.5 | 3.0 | 3.6 | 1.1 | 0.0 | 3.5 | 1.7 | 2.1 | 0.7 | 0.4 |
| Conference | 16 | 16 | 32.6 | 0.7 | 3.0 | 3.7 | 1.1 | 0.0 | 3.7 | 1.9 | 2.0 | 0.6 | 0.4 | |
| Exhibition | 2 | 2 | 22.5 | 0.0 | 2.5 | 2.5 | 0.5 | 0.0 | 5.0 | 1.0 | 5.0 | 0.5 | 0.0 | |
| Location | Home | 11 | 11 | 29.7 | 0.4 | 2.5 | 2.9 | 1.0 | 0.0 | 3.7 | 1.7 | 2.2 | 0.5 | 0.5 |
| Away | 10 | 9 | 32.0 | 0.7 | 3.6 | 4.3 | 1.3 | 0.0 | 3.3 | 1.6 | 2.1 | 0.8 | 0.3 | |
| Neutral | - | - | - | - | - | - | - | - | - | - | - | - | - | |
| Result | Wins | 13 | 12 | 32.2 | 0.3 | 2.7 | 3.0 | 1.1 | 0.0 | 4.0 | 1.6 | 2.5 | 0.8 | 0.4 |
| Losses | 8 | 8 | 28.6 | 0.9 | 3.6 | 4.5 | 1.3 | 0.0 | 2.8 | 1.8 | 1.6 | 0.5 | 0.4 | |
| Month | November | 2 | 2 | 16.0 | 0.0 | 1.5 | 1.5 | 1.0 | 0.0 | 1.5 | 0.5 | 3.0 | 0.0 | 0.0 |
| December | 5 | 4 | 32.2 | 0.0 | 4.0 | 4.0 | 0.8 | 0.0 | 4.8 | 1.4 | 3.4 | 0.8 | 0.6 | |
| January | 7 | 7 | 31.4 | 0.7 | 2.7 | 3.4 | 1.4 | 0.0 | 2.6 | 2.6 | 1.0 | 0.6 | 0.3 | |
| February | 7 | 7 | 33.4 | 0.9 | 3.1 | 4.0 | 1.1 | 0.0 | 4.1 | 1.3 | 3.2 | 0.9 | 0.4 |
Splits Stats - Ball control totals
| gp | gs | min | off | def | reb | pf | dq | ast | to | a/to | stl | blk | ||
|---|---|---|---|---|---|---|---|---|---|---|---|---|---|---|
| Event | Total | 21 | 20 | 647 | 11 | 64 | 75 | 24 | 0 | 74 | 35 | 2.1 | 14 | 8 |
| Conference | 16 | 16 | 521 | 11 | 48 | 59 | 18 | 0 | 59 | 30 | 2.0 | 10 | 7 | |
| Exhibition | 2 | 2 | 45 | 0 | 5 | 5 | 1 | 0 | 10 | 2 | 5.0 | 1 | 0 | |
| Location | Home | 11 | 11 | 327 | 4 | 28 | 32 | 11 | 0 | 41 | 19 | 2.2 | 6 | 5 |
| Away | 10 | 9 | 320 | 7 | 36 | 43 | 13 | 0 | 33 | 16 | 2.1 | 8 | 3 | |
| Neutral | - | - | - | - | - | - | - | - | - | - | - | - | - | |
| Result | Wins | 13 | 12 | 418 | 4 | 35 | 39 | 14 | 0 | 52 | 21 | 2.5 | 10 | 5 |
| Losses | 8 | 8 | 229 | 7 | 29 | 36 | 10 | 0 | 22 | 14 | 1.6 | 4 | 3 | |
| Month | November | 2 | 2 | 32 | 0 | 3 | 3 | 2 | 0 | 3 | 1 | 3.0 | 0 | 0 |
| December | 5 | 4 | 161 | 0 | 20 | 20 | 4 | 0 | 24 | 7 | 3.4 | 4 | 3 | |
| January | 7 | 7 | 220 | 5 | 19 | 24 | 10 | 0 | 18 | 18 | 1.0 | 4 | 2 | |
| February | 7 | 7 | 234 | 6 | 22 | 28 | 8 | 0 | 29 | 9 | 3.2 | 6 | 3 |
Splits Stats - Ball control per 40 min
| gp | gs | mpg | off/40 | def/40 | reb/40 | pf/40 | dq/40 | ast/40 | to/40 | a/to | stl/40 | blk/40 | ||
|---|---|---|---|---|---|---|---|---|---|---|---|---|---|---|
| Event | Total | 21 | 20 | 30.8 | 0.7 | 4.0 | 4.6 | 1.5 | 0.0 | 4.6 | 2.2 | 2.1 | 0.9 | 0.5 |
| Conference | 16 | 16 | 32.6 | 0.8 | 3.7 | 4.5 | 1.4 | 0.0 | 4.5 | 2.3 | 2.0 | 0.8 | 0.5 | |
| Exhibition | 2 | 2 | 22.5 | 0.0 | 4.4 | 4.4 | 0.9 | 0.0 | 8.9 | 1.8 | 5.0 | 0.9 | 0.0 | |
| Location | Home | 11 | 11 | 29.7 | 0.5 | 3.4 | 3.9 | 1.3 | 0.0 | 5.0 | 2.3 | 2.2 | 0.7 | 0.6 |
| Away | 10 | 9 | 32.0 | 0.9 | 4.5 | 5.4 | 1.6 | 0.0 | 4.1 | 2.0 | 2.1 | 1.0 | 0.4 | |
| Neutral | - | - | - | - | - | - | - | - | - | - | - | - | - | |
| Result | Wins | 13 | 12 | 32.2 | 0.4 | 3.3 | 3.7 | 1.3 | 0.0 | 5.0 | 2.0 | 2.5 | 1.0 | 0.5 |
| Losses | 8 | 8 | 28.6 | 1.2 | 5.1 | 6.3 | 1.7 | 0.0 | 3.8 | 2.4 | 1.6 | 0.7 | 0.5 | |
| Month | November | 2 | 2 | 16.0 | 0.0 | 3.8 | 3.8 | 2.5 | 0.0 | 3.8 | 1.3 | 3.0 | 0.0 | 0.0 |
| December | 5 | 4 | 32.2 | 0.0 | 5.0 | 5.0 | 1.0 | 0.0 | 6.0 | 1.7 | 3.4 | 1.0 | 0.7 | |
| January | 7 | 7 | 31.4 | 0.9 | 3.5 | 4.4 | 1.8 | 0.0 | 3.3 | 3.3 | 1.0 | 0.7 | 0.4 | |
| February | 7 | 7 | 33.4 | 1.0 | 3.8 | 4.8 | 1.4 | 0.0 | 5.0 | 1.5 | 3.2 | 1.0 | 0.5 |