
-
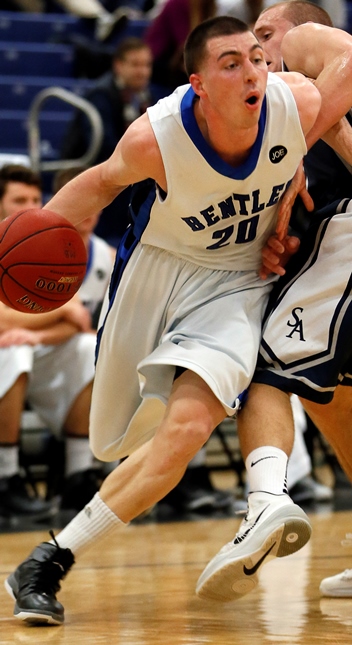
- Height:
- 6-4
-
- Weight:
- 180
-
- Year:
- Jr.
-
- Hometown:
- Red Bank, N.J.
-
- High School:
- Christian Brothers Academy
-
- Position:
- G
-
- Mile Time:
- 5:24
-
- gp
- 24
-
- pts/g
- 8.7
-
- fg %
- 46.9
-
- 3pt %
- 35.7
-
- ft %
- 69.8
-
- reb/g
- 5.3
-
- a/g
- 2.6
Bio
 Career Notes
Played in 77 consecutive games to start his career before an injury forced him to miss the final five of his junior season … career averages of 8.1 points, 4.0 rebounds, 1.7 assists and 1.2 steals … will enter senior year with 626 points and 309 rebounds … owns the school record for consecutive free throws made (36), a streak that began Jan. 23, 2013 and ran through Nov. 13, 2013.
2013-14 Season
Averaged 8.7 points, 5.3 rebounds, 2.6 assists and 1.5 steals in 24 starts before a shoulder injury prematurely ended his season … shot .508 from two-point range and .469 overall … led team in steals (37) and was third on the squad in minutes per game (28.5), average rebounds (5.3) and assists (63) … was seventh in the Northeast-10 in steals per game and 11th in total steals (37) … scored in doubles nine times, including eight of the first 13 games … included was a season-high 21 points against Post on Jan. 4 … collected career-high 11 rebounds, all at the defensive end, Feb. 1 at Pace, and had two other games with nine boards … seven steals against Goldey-Beacom Dec. 21 was the most by a Bentley player since Mike Quinn in Dec. 2010 … also had 12 points and eight rebounds against the Lightning … extended the school record for consecutive free throws made to 36, a streak that lasted from Jan. 23 to Nov. 13, 2013 … scored his 500th career point Dec. 7 against St. Michael’s … named to the Northeast-10 Weekly Honor Roll Jan. 6 … made 14 of 30 three-pointers (.467) over his final 17 games.
2012-13 Season
Was third on the team in scoring, averaging 10.3 points along with 3.9 rebounds and a team-best 1.7 steals … rebound average was the second best on the team … was one of only four NE-10 players to average at least 3.9 boards and 1.7 steals … started the team’s final 23 games after coming off the bench in the first three … sixth in NE-10 in steals per game and 11th in free throw percentage … finished the season by making his final 29 free throws, breaking the school record of 28 set by Tom Quinlan in 1994 … that streak was achieved over the course of 11 games … scored in doubles 14 times, including five straight from Feb. 2-16 … erupted for a career-best 25 points at St. Michael’s Nov. 28 and gave the Falcons 21 points two games later against Franklin Pierce … in both of those, buried four of six three-pointers … made four of five treys during an 18-point effort Jan. 19 at Saint Rose … recorded his first double-double Feb. 2 at Southern Connecticut, finishing with 12 points and a career-best 10 rebounds … other highs included seven assists against AIC on Jan. 15 and five steals against St. Michael’s Feb. 12.
2011-12 Season
Averaged 5.3 points and 3.0 rebounds as one of five Falcons to appear in every game … played 17.6 minutes per game … started three consecutive games from Feb. 4-11 … in that role, averaged 4.3 points and 5.3 rebounds … six points and a season-high eight rebounds Feb. 4 vs. Saint Anselm in first career start … debuted with 12 points in 18 minutes Nov. 11 against Felician … scored in doubles four times with a high of 14 Jan. 28 against Southern Connecticut State … against the Owls, buried four of five from outside the arc … 10 points, four assists vs. Franklin Pierce Feb. 14 … eight points, three steals against Saint Rose a month earlier … played at least 22 minutes in each of the last 10 games, averaging 6.6 points and 4.6 rebounds over that span … in home games, connected at a 44 percent clip (15-34) from three-point land.
Before Bentley
2011 graduate of Christian Brothers Academy, where he was a team captain as a senior … that was also the alma mater of former Falcon point guard Pat Lynch (2000-04) … helped CBA to Shore Conference championship in 2009 and 2010 … honors included first-team All-Shore, first-team All-Monmouth County, first-team Asbury Park Press All-Star and team MVP … during his senior year, averaged 17.6 points, 4.4 rebounds, 4.9 assists and 3.8 steals … career averages of 16.1 points, 4.3 rebounds, 4.5 assists and 3.2 steals … played in 2011 All-Shore All-Star game … MVP of 2010 Shore Conference Tournament … played AAU with the NJ Shoreshots and the Central Jersey Hawks.
Personal
Is majoring in management … age as of Nov. 15, 2013: 21 … son of Joe and Mary Koury … has one sister, Caitlin (22), and one brother, Jack (15) … father was a soccer goalie at Bowling Green University … named after his father.
Player Profile
| Recent Games | ||
|---|---|---|
| Feb 15 | at St. Michael's | L, 69-66 |
| Feb 19 | at Southern N.H. | L, 81-62 |
| Feb 22 | Stonehill | L, 97-83 |
| Feb 25 | Franklin Pierce | W, 80-66 |
| Feb 28 | at St. Rose | W, 93-79 |
| Mar 2 | at Saint Anselm | L, 79-78 |
| Overall | Conf | |||
|---|---|---|---|---|
| Games | 24 | 18 | ||
| Games started | 24 | 18 | ||
| Minutes | 685 | 519 | ||
| Minutes per game | 28.5 | 28.8 | ||
| FG | 75-160 | 54-119 | ||
| FG Pct | 46.9 | 45.4 | ||
| 3PT | 15-42 | 13-31 | ||
| 3PT Pct | 35.7 | 41.9 | ||
| FT | 44-63 | 19-31 | ||
| FT Pct | 69.8 | 61.3 | ||
| Off rebounds | 30 | 15 | ||
| Def rebounds | 98 | 74 | ||
| Total rebounds | 128 | 89 | ||
| Rebounds per game | 5.3 | 4.9 | ||
| Personal fouls | 45 | 35 | ||
| Disqualifications | 0 | 0 | ||
| Assists | 63 | 51 | ||
| Turnovers | 36 | 30 | ||
| Assist to turnover ratio | 1.8 | 1.7 | ||
| Steals | 37 | 27 | ||
| Blocks | 5 | 3 | ||
| Points | 209 | 140 | ||
| Points per game | 8.7 | 7.8 | ||
| Points per 40 min | 12.2 | 10.8 | ||
Game Log - Shooting
| Date | Opponent | Score | gs | min | fg | pct | 3pt | pct | ft | pct | pts |
|---|---|---|---|---|---|---|---|---|---|---|---|
| Nov 8 | Concordia (N.Y.) | W, 98-69 | 1 | 18 | 1-4 | 25.0 | 0-2 | 0.0 | 4-4 | 100.0 | 6 |
| Nov 9 | Wilmington (Del.) | W, 90-50 | 1 | 24 | 1-5 | 20.0 | 0-1 | 0.0 | 2-2 | 100.0 | 4 |
| Nov 13 | at Saint Anselm | W, 102-96 | 1 | 26 | 5-8 | 62.5 | 0-1 | 0.0 | 2-5 | 40.0 | 12 |
| Nov 17 | Holy Family | W, 82-75 | 1 | 33 | 3-7 | 42.9 | 0-2 | 0.0 | 6-9 | 66.7 | 12 |
| Nov 20 | Assumption | W, 88-76 | 1 | 22 | 4-6 | 66.7 | 0-1 | 0.0 | 2-5 | 40.0 | 10 |
| Nov 23 | at Stonehill | W, 81-63 | 1 | 28 | 6-10 | 60.0 | 1-4 | 25.0 | 2-2 | 100.0 | 15 |
| Nov 26 | Southern N.H. | W, 89-84 | 1 | 27 | 2-4 | 50.0 | 0-1 | 0.0 | 0-0 | - | 4 |
| Dec 4 | at Merrimack | L, 83-70 | 1 | 34 | 4-7 | 57.1 | 1-2 | 50.0 | 4-4 | 100.0 | 13 |
| Dec 7 | St. Michael's | L, 92-82 | 1 | 34 | 3-9 | 33.3 | 2-4 | 50.0 | 0-0 | - | 8 |
| Dec 10 | at Franklin Pierce | L, 93-84 | 1 | 34 | 2-9 | 22.2 | 0-0 | - | 0-1 | 0.0 | 4 |
| Dec 21 | Goldey-Beacom | W, 99-65 | 1 | 27 | 5-7 | 71.4 | 0-1 | 0.0 | 2-3 | 66.7 | 12 |
| Jan 3 | at Dominican (N.Y.) | W, 76-57 | 1 | 30 | 6-9 | 66.7 | 1-1 | 100.0 | 1-2 | 50.0 | 14 |
| Jan 4 | vs. Post | W, 61-53 | 1 | 34 | 5-9 | 55.6 | 1-4 | 25.0 | 10-12 | 83.3 | 21 |
| Jan 8 | at Le Moyne | W, 82-73 | 1 | 34 | 3-10 | 30.0 | 1-4 | 25.0 | 0-0 | - | 7 |
| Jan 11 | Southern Conn. St. | L, 88-76 | 1 | 25 | 1-4 | 25.0 | 0-1 | 0.0 | 2-2 | 100.0 | 4 |
| Jan 15 | Adelphi | W, 75-51 | 1 | 26 | 2-3 | 66.7 | 1-1 | 100.0 | 0-1 | 0.0 | 5 |
| Jan 18 | at American Int'l | W, 78-64 | 1 | 33 | 2-7 | 28.6 | 2-3 | 66.7 | 1-2 | 50.0 | 7 |
| Jan 22 | at New Haven | L, 72-70 | 1 | 31 | 3-8 | 37.5 | 1-2 | 50.0 | 1-1 | 100.0 | 8 |
| Jan 25 | Saint Anselm | L, 88-79 | 1 | 31 | 4-7 | 57.1 | 0-1 | 0.0 | 1-2 | 50.0 | 9 |
| Jan 29 | St. Rose | W, 95-87 | 1 | 26 | 2-4 | 50.0 | 1-1 | 100.0 | 0-0 | - | 5 |
| Feb 1 | at Pace | L, 65-62 | 1 | 33 | 3-9 | 33.3 | 0-2 | 0.0 | 3-4 | 75.0 | 9 |
| Feb 6 | at Assumption | W, 89-48 | 1 | 24 | 3-4 | 75.0 | 1-1 | 100.0 | 1-2 | 50.0 | 8 |
| Feb 11 | Merrimack | W, 95-94 | 1 | 27 | 4-6 | 66.7 | 2-2 | 100.0 | 0-0 | - | 10 |
| Feb 15 | at St. Michael's | L, 69-66 | 1 | 24 | 1-4 | 25.0 | 0-0 | - | 0-0 | - | 2 |
| Feb 19 | at Southern N.H. | L, 81-62 | - | - | - | - | - | - | - | - | - |
| Feb 22 | Stonehill | L, 97-83 | - | - | - | - | - | - | - | - | - |
| Feb 25 | Franklin Pierce | W, 80-66 | - | - | - | - | - | - | - | - | - |
| Feb 28 | at St. Rose | W, 93-79 | - | - | - | - | - | - | - | - | - |
| Mar 2 | at Saint Anselm | L, 79-78 | - | - | - | - | - | - | - | - | - |
Game Log - Ball control
| Date | Opponent | Score | gs | min | off | def | reb | ast | to | a/to | stl | blk | pf | dq |
|---|---|---|---|---|---|---|---|---|---|---|---|---|---|---|
| Nov 8 | Concordia (N.Y.) | W, 98-69 | 1 | 18 | 3 | 0 | 3 | 1 | 0 | - | 0 | 0 | 3 | 0 |
| Nov 9 | Wilmington (Del.) | W, 90-50 | 1 | 24 | 4 | 2 | 6 | 4 | 0 | - | 0 | 0 | 1 | - |
| Nov 13 | at Saint Anselm | W, 102-96 | 1 | 26 | 0 | 3 | 3 | 1 | 2 | 0.5 | 3 | 0 | 3 | 0 |
| Nov 17 | Holy Family | W, 82-75 | 1 | 33 | 1 | 5 | 6 | 4 | 1 | 4.0 | 2 | 0 | 3 | 0 |
| Nov 20 | Assumption | W, 88-76 | 1 | 22 | 0 | 2 | 2 | 3 | 2 | 1.5 | 0 | 0 | 2 | 0 |
| Nov 23 | at Stonehill | W, 81-63 | 1 | 28 | 1 | 4 | 5 | 4 | 2 | 2.0 | 1 | 1 | 1 | 0 |
| Nov 26 | Southern N.H. | W, 89-84 | 1 | 27 | 1 | 5 | 6 | 5 | 5 | 1.0 | 1 | 1 | 4 | 0 |
| Dec 4 | at Merrimack | L, 83-70 | 1 | 34 | 1 | 4 | 5 | 2 | 2 | 1.0 | 0 | 0 | 3 | 0 |
| Dec 7 | St. Michael's | L, 92-82 | 1 | 34 | 1 | 5 | 6 | 4 | 0 | - | 4 | 0 | 1 | 0 |
| Dec 10 | at Franklin Pierce | L, 93-84 | 1 | 34 | 1 | 5 | 6 | 4 | 1 | 4.0 | 1 | 0 | 4 | 0 |
| Dec 21 | Goldey-Beacom | W, 99-65 | 1 | 27 | 3 | 5 | 8 | 2 | 2 | 1.0 | 7 | 0 | 1 | 0 |
| Jan 3 | at Dominican (N.Y.) | W, 76-57 | 1 | 30 | 1 | 6 | 7 | 1 | 3 | 0.3 | 0 | 2 | 1 | 0 |
| Jan 4 | vs. Post | W, 61-53 | 1 | 34 | 3 | 6 | 9 | 0 | 0 | - | 1 | 0 | 1 | 0 |
| Jan 8 | at Le Moyne | W, 82-73 | 1 | 34 | 1 | 3 | 4 | 3 | 0 | - | 3 | 0 | 2 | 0 |
| Jan 11 | Southern Conn. St. | L, 88-76 | 1 | 25 | 2 | 2 | 4 | 3 | 2 | 1.5 | 0 | 0 | 3 | 0 |
| Jan 15 | Adelphi | W, 75-51 | 1 | 26 | 1 | 5 | 6 | 2 | 2 | 1.0 | 0 | 0 | 1 | 0 |
| Jan 18 | at American Int'l | W, 78-64 | 1 | 33 | 0 | 2 | 2 | 2 | 3 | 0.7 | 1 | 0 | 0 | 0 |
| Jan 22 | at New Haven | L, 72-70 | 1 | 31 | 1 | 4 | 5 | 1 | 0 | - | 1 | 0 | 0 | 0 |
| Jan 25 | Saint Anselm | L, 88-79 | 1 | 31 | 3 | 6 | 9 | 5 | 2 | 2.5 | 6 | 0 | 2 | 0 |
| Jan 29 | St. Rose | W, 95-87 | 1 | 26 | 2 | 3 | 5 | 1 | 1 | 1.0 | 0 | 0 | 4 | 0 |
| Feb 1 | at Pace | L, 65-62 | 1 | 33 | 0 | 11 | 11 | 4 | 1 | 4.0 | 0 | 1 | 1 | 0 |
| Feb 6 | at Assumption | W, 89-48 | 1 | 24 | 0 | 6 | 6 | 4 | 2 | 2.0 | 2 | 0 | 0 | 0 |
| Feb 11 | Merrimack | W, 95-94 | 1 | 27 | 0 | 3 | 3 | 2 | 1 | 2.0 | 2 | 0 | 4 | 0 |
| Feb 15 | at St. Michael's | L, 69-66 | 1 | 24 | 0 | 1 | 1 | 1 | 2 | 0.5 | 2 | 0 | 0 | 0 |
| Feb 19 | at Southern N.H. | L, 81-62 | - | - | - | - | - | - | - | - | - | - | - | - |
| Feb 22 | Stonehill | L, 97-83 | - | - | - | - | - | - | - | - | - | - | - | - |
| Feb 25 | Franklin Pierce | W, 80-66 | - | - | - | - | - | - | - | - | - | - | - | - |
| Feb 28 | at St. Rose | W, 93-79 | - | - | - | - | - | - | - | - | - | - | - | - |
| Mar 2 | at Saint Anselm | L, 79-78 | - | - | - | - | - | - | - | - | - | - | - | - |
Career Stats - Shooting per game
| gp | gs | min/g | fg/g | pct | 3pt/g | pct | ft/g | pct | ppg | |
|---|---|---|---|---|---|---|---|---|---|---|
| 2011-12 | 27 | 3 | 17.6 | 1.7-4.3 | 40.9 | 0.8-2.1 | 36.8 | 1.0-1.4 | 73.7 | 5.3 |
| 2012-13 | 26 | 23 | 29.1 | 3.6-8.5 | 42.3 | 1.1-3.7 | 30.2 | 2.2-2.7 | 81.4 | 10.5 |
| 2013-14 | 24 | 24 | 28.5 | 3.1-6.7 | 46.9 | 0.6-1.8 | 35.7 | 1.8-2.6 | 69.8 | 8.7 |
| 2014-15 | 26 | 26 | 29.7 | 3.4-7.8 | 43.6 | 0.8-2.7 | 29.0 | 2.2-2.8 | 79.5 | 9.8 |
| Total | 103 | 76 | 26.1 | 3.0-6.8 | 43.5 | 0.8-2.6 | 32.2 | 1.8-2.4 | 76.6 | 8.5 |
Career Stats - Shooting totals
| gp | gs | min | fg | pct | 3pt | pct | ft | pct | pts | |
|---|---|---|---|---|---|---|---|---|---|---|
| 2011-12 | 27 | 3 | 474 | 47-115 | 40.9 | 21-57 | 36.8 | 28-38 | 73.7 | 143 |
| 2012-13 | 26 | 23 | 756 | 94-222 | 42.3 | 29-96 | 30.2 | 57-70 | 81.4 | 274 |
| 2013-14 | 24 | 24 | 685 | 75-160 | 46.9 | 15-42 | 35.7 | 44-63 | 69.8 | 209 |
| 2014-15 | 26 | 26 | 771 | 88-202 | 43.6 | 20-69 | 29.0 | 58-73 | 79.5 | 254 |
| Total | 103 | 76 | 2686 | 304-699 | 43.5 | 85-264 | 32.2 | 187-244 | 76.6 | 880 |
Career Stats - Shooting per 40 min
| gp | gs | min/g | fg/40 | pct | 3pt/40 | pct | ft/40 | pct | pts/40 | |
|---|---|---|---|---|---|---|---|---|---|---|
| 2011-12 | 27 | 3 | 17.6 | 4.0-9.7 | 40.9 | 1.8-4.8 | 36.8 | 2.4-3.2 | 73.7 | 12.1 |
| 2012-13 | 26 | 23 | 29.1 | 5.0-11.7 | 42.3 | 1.5-5.1 | 30.2 | 3.0-3.7 | 81.4 | 14.5 |
| 2013-14 | 24 | 24 | 28.5 | 4.4-9.3 | 46.9 | 0.9-2.5 | 35.7 | 2.6-3.7 | 69.8 | 12.2 |
| 2014-15 | 26 | 26 | 29.7 | 4.6-10.5 | 43.6 | 1.0-3.6 | 29.0 | 3.0-3.8 | 79.5 | 13.2 |
| Total | 103 | 76 | 26.1 | 4.5-10.4 | 43.5 | 1.3-3.9 | 32.2 | 2.8-3.6 | 76.6 | 13.1 |
Career Stats - Ball control per game
| gp | gs | mpg | off/g | def/g | reb/g | pf/g | dq/g | ast/g | to/g | a/to | stl/g | blk/g | |
|---|---|---|---|---|---|---|---|---|---|---|---|---|---|
| 2011-12 | 27 | 3 | 17.6 | 0.7 | 2.3 | 3.0 | 1.0 | 0.0 | 1.0 | 0.9 | 1.1 | 0.4 | 0.0 |
| 2012-13 | 26 | 23 | 29.1 | 0.8 | 3.1 | 3.9 | 1.7 | 0.0 | 1.7 | 1.5 | 1.2 | 1.7 | 0.1 |
| 2013-14 | 24 | 24 | 28.5 | 1.3 | 4.1 | 5.3 | 1.9 | 0.0 | 2.6 | 1.5 | 1.8 | 1.5 | 0.2 |
| 2014-15 | 26 | 26 | 29.7 | 1.3 | 3.3 | 4.7 | 1.7 | 0.0 | 2.2 | 1.8 | 1.2 | 1.7 | 0.2 |
| Total | 103 | 76 | 26.1 | 1.0 | 3.2 | 4.2 | 1.6 | 0.0 | 1.9 | 1.4 | 1.3 | 1.3 | 0.1 |
Career Stats - Ball control totals
Career Stats - Ball control per 40 min
| gp | gs | mpg | off/40 | def/40 | reb/40 | pf/40 | dq/40 | ast/40 | to/40 | a/to | stl/40 | blk/40 | |
|---|---|---|---|---|---|---|---|---|---|---|---|---|---|
| 2011-12 | 27 | 3 | 17.6 | 1.6 | 5.1 | 6.8 | 2.4 | 0.1 | 2.2 | 1.9 | 1.1 | 1.0 | 0.0 |
| 2012-13 | 26 | 23 | 29.1 | 1.1 | 4.3 | 5.3 | 2.3 | 0.0 | 2.3 | 2.0 | 1.2 | 2.4 | 0.1 |
| 2013-14 | 24 | 24 | 28.5 | 1.8 | 5.7 | 7.5 | 2.6 | 0.0 | 3.7 | 2.1 | 1.8 | 2.2 | 0.3 |
| 2014-15 | 26 | 26 | 29.7 | 1.8 | 4.5 | 6.3 | 2.3 | 0.0 | 3.0 | 2.5 | 1.2 | 2.2 | 0.2 |
| Total | 103 | 76 | 26.1 | 1.5 | 4.9 | 6.4 | 2.4 | 0.0 | 2.8 | 2.2 | 1.3 | 2.0 | 0.2 |
Splits Stats - Shooting per game
| gp | gs | min/g | fg/g | pct | 3pt/g | pct | ft/g | pct | ppg | ||
|---|---|---|---|---|---|---|---|---|---|---|---|
| Event | Total | 24 | 24 | 28.5 | 3.1-6.7 | 46.9 | 0.6-1.8 | 35.7 | 1.8-2.6 | 69.8 | 8.7 |
| Conference | 18 | 18 | 28.8 | 3.0-6.6 | 45.4 | 0.7-1.7 | 41.9 | 1.1-1.7 | 61.3 | 7.8 | |
| Exhibition | - | - | - | 0.0-0.0 | - | 0.0-0.0 | - | 0.0-0.0 | - | - | |
| Location | Home | 12 | 12 | 26.7 | 2.7-5.5 | 48.5 | 0.5-1.5 | 33.3 | 1.6-2.3 | 67.9 | 7.4 |
| Away | 11 | 11 | 30.1 | 3.5-7.7 | 44.7 | 0.7-1.8 | 40.0 | 1.4-2.1 | 65.2 | 9.0 | |
| Neutral | 1 | 1 | 34.0 | 5.0-9.0 | 55.6 | 1.0-4.0 | 25.0 | 10.0-12.0 | 83.3 | 21.0 | |
| Result | Wins | 16 | 16 | 27.4 | 3.4-6.4 | 52.4 | 0.7-1.9 | 36.7 | 2.1-3.1 | 67.3 | 9.5 |
| Losses | 8 | 8 | 30.8 | 2.6-7.1 | 36.8 | 0.5-1.5 | 33.3 | 1.4-1.8 | 78.6 | 7.1 | |
| Month | November | 7 | 7 | 25.4 | 3.1-6.3 | 50.0 | 0.1-1.7 | 8.3 | 2.6-3.9 | 66.7 | 9.0 |
| December | 4 | 4 | 32.3 | 3.5-8.0 | 43.8 | 0.8-1.8 | 42.9 | 1.5-2.0 | 75.0 | 9.3 | |
| January | 9 | 9 | 30.0 | 3.1-6.8 | 45.9 | 0.9-2.0 | 44.4 | 1.8-2.4 | 72.7 | 8.9 | |
| February | 4 | 4 | 27.0 | 2.8-5.8 | 47.8 | 0.8-1.2 | 60.0 | 1.0-1.5 | 66.7 | 7.3 |
Splits Stats - Shooting totals
| gp | gs | min | fg | pct | 3pt | pct | ft | pct | pts | ||
|---|---|---|---|---|---|---|---|---|---|---|---|
| Event | Total | 24 | 24 | 685 | 75-160 | 46.9 | 15-42 | 35.7 | 44-63 | 69.8 | 209 |
| Conference | 18 | 18 | 519 | 54-119 | 45.4 | 13-31 | 41.9 | 19-31 | 61.3 | 140 | |
| Exhibition | - | - | - | 0-0 | - | 0-0 | - | 0-0 | - | 0 | |
| Location | Home | 12 | 12 | 320 | 32-66 | 48.5 | 6-18 | 33.3 | 19-28 | 67.9 | 89 |
| Away | 11 | 11 | 331 | 38-85 | 44.7 | 8-20 | 40.0 | 15-23 | 65.2 | 99 | |
| Neutral | 1 | 1 | 34 | 5-9 | 55.6 | 1-4 | 25.0 | 10-12 | 83.3 | 21 | |
| Result | Wins | 16 | 16 | 439 | 54-103 | 52.4 | 11-30 | 36.7 | 33-49 | 67.3 | 152 |
| Losses | 8 | 8 | 246 | 21-57 | 36.8 | 4-12 | 33.3 | 11-14 | 78.6 | 57 | |
| Month | November | 7 | 7 | 178 | 22-44 | 50.0 | 1-12 | 8.3 | 18-27 | 66.7 | 63 |
| December | 4 | 4 | 129 | 14-32 | 43.8 | 3-7 | 42.9 | 6-8 | 75.0 | 37 | |
| January | 9 | 9 | 270 | 28-61 | 45.9 | 8-18 | 44.4 | 16-22 | 72.7 | 80 | |
| February | 4 | 4 | 108 | 11-23 | 47.8 | 3-5 | 60.0 | 4-6 | 66.7 | 29 |
Splits Stats - Shooting per 40 min
| gp | gs | min/g | fg/40 | pct | 3pt/40 | pct | ft/40 | pct | pts/40 | ||
|---|---|---|---|---|---|---|---|---|---|---|---|
| Event | Total | 24 | 24 | 28.5 | 4.4-9.3 | 46.9 | 0.9-2.5 | 35.7 | 2.6-3.7 | 69.8 | 12.2 |
| Conference | 18 | 18 | 28.8 | 4.2-9.2 | 45.4 | 1.0-2.4 | 41.9 | 1.5-2.4 | 61.3 | 10.8 | |
| Exhibition | - | - | - | 0.0-0.0 | - | 0.0-0.0 | - | 0.0-0.0 | - | - | |
| Location | Home | 12 | 12 | 26.7 | 4.0-8.2 | 48.5 | 0.8-2.2 | 33.3 | 2.4-3.5 | 67.9 | 11.1 |
| Away | 11 | 11 | 30.1 | 4.6-10.3 | 44.7 | 1.0-2.4 | 40.0 | 1.8-2.8 | 65.2 | 12.0 | |
| Neutral | 1 | 1 | 34.0 | 5.9-10.6 | 55.6 | 1.2-4.7 | 25.0 | 11.8-14.1 | 83.3 | 24.7 | |
| Result | Wins | 16 | 16 | 27.4 | 4.9-9.4 | 52.4 | 1.0-2.7 | 36.7 | 3.0-4.5 | 67.3 | 13.8 |
| Losses | 8 | 8 | 30.8 | 3.4-9.3 | 36.8 | 0.7-2.0 | 33.3 | 1.8-2.3 | 78.6 | 9.3 | |
| Month | November | 7 | 7 | 25.4 | 4.9-9.9 | 50.0 | 0.2-2.7 | 8.3 | 4.0-6.1 | 66.7 | 14.2 |
| December | 4 | 4 | 32.3 | 4.3-9.9 | 43.8 | 0.9-2.2 | 42.9 | 1.9-2.5 | 75.0 | 11.5 | |
| January | 9 | 9 | 30.0 | 4.1-9.0 | 45.9 | 1.2-2.7 | 44.4 | 2.4-3.3 | 72.7 | 11.9 | |
| February | 4 | 4 | 27.0 | 4.1-8.5 | 47.8 | 1.1-1.9 | 60.0 | 1.5-2.2 | 66.7 | 10.7 |
Splits Stats - Ball control per game
| gp | gs | mpg | off/g | def/g | reb/g | pf/g | dq/g | ast/g | to/g | a/to | stl/g | blk/g | ||
|---|---|---|---|---|---|---|---|---|---|---|---|---|---|---|
| Event | Total | 24 | 24 | 28.5 | 1.3 | 4.1 | 5.3 | 1.9 | 0.0 | 2.6 | 1.5 | 1.8 | 1.5 | 0.2 |
| Conference | 18 | 18 | 28.8 | 0.8 | 4.1 | 4.9 | 1.9 | 0.0 | 2.8 | 1.7 | 1.7 | 1.5 | 0.2 | |
| Exhibition | - | - | - | - | - | - | - | - | - | - | - | - | - | |
| Location | Home | 12 | 12 | 26.7 | 1.8 | 3.6 | 5.3 | 2.4 | 0.0 | 3.0 | 1.5 | 2.0 | 1.8 | 0.1 |
| Away | 11 | 11 | 30.1 | 0.5 | 4.5 | 5.0 | 1.4 | 0.0 | 2.5 | 1.6 | 1.5 | 1.3 | 0.4 | |
| Neutral | 1 | 1 | 34.0 | 3.0 | 6.0 | 9.0 | 1.0 | 0.0 | 0.0 | 0.0 | - | 1.0 | 0.0 | |
| Result | Wins | 16 | 16 | 27.4 | 1.3 | 3.8 | 5.1 | 1.9 | 0.0 | 2.4 | 1.6 | 1.5 | 1.4 | 0.3 |
| Losses | 8 | 8 | 30.8 | 1.1 | 4.8 | 5.9 | 1.8 | 0.0 | 3.0 | 1.3 | 2.4 | 1.8 | 0.1 | |
| Month | November | 7 | 7 | 25.4 | 1.4 | 3.0 | 4.4 | 2.4 | 0.0 | 3.1 | 1.7 | 1.8 | 1.0 | 0.3 |
| December | 4 | 4 | 32.3 | 1.5 | 4.8 | 6.3 | 2.3 | 0.0 | 3.0 | 1.3 | 2.4 | 3.0 | 0.0 | |
| January | 9 | 9 | 30.0 | 1.6 | 4.1 | 5.7 | 1.6 | 0.0 | 2.0 | 1.4 | 1.4 | 1.3 | 0.2 | |
| February | 4 | 4 | 27.0 | 0.0 | 5.3 | 5.3 | 1.3 | 0.0 | 2.8 | 1.5 | 1.8 | 1.5 | 0.3 |
Splits Stats - Ball control totals
| gp | gs | min | off | def | reb | pf | dq | ast | to | a/to | stl | blk | ||
|---|---|---|---|---|---|---|---|---|---|---|---|---|---|---|
| Event | Total | 24 | 24 | 685 | 30 | 98 | 128 | 45 | 0 | 63 | 36 | 1.8 | 37 | 5 |
| Conference | 18 | 18 | 519 | 15 | 74 | 89 | 35 | 0 | 51 | 30 | 1.7 | 27 | 3 | |
| Exhibition | - | - | - | - | - | - | - | - | - | - | - | - | - | |
| Location | Home | 12 | 12 | 320 | 21 | 43 | 64 | 29 | 0 | 36 | 18 | 2.0 | 22 | 1 |
| Away | 11 | 11 | 331 | 6 | 49 | 55 | 15 | 0 | 27 | 18 | 1.5 | 14 | 4 | |
| Neutral | 1 | 1 | 34 | 3 | 6 | 9 | 1 | 0 | 0 | 0 | - | 1 | 0 | |
| Result | Wins | 16 | 16 | 439 | 21 | 60 | 81 | 31 | 0 | 39 | 26 | 1.5 | 23 | 4 |
| Losses | 8 | 8 | 246 | 9 | 38 | 47 | 14 | 0 | 24 | 10 | 2.4 | 14 | 1 | |
| Month | November | 7 | 7 | 178 | 10 | 21 | 31 | 17 | 0 | 22 | 12 | 1.8 | 7 | 2 |
| December | 4 | 4 | 129 | 6 | 19 | 25 | 9 | 0 | 12 | 5 | 2.4 | 12 | 0 | |
| January | 9 | 9 | 270 | 14 | 37 | 51 | 14 | 0 | 18 | 13 | 1.4 | 12 | 2 | |
| February | 4 | 4 | 108 | 0 | 21 | 21 | 5 | 0 | 11 | 6 | 1.8 | 6 | 1 |
Splits Stats - Ball control per 40 min
| gp | gs | mpg | off/40 | def/40 | reb/40 | pf/40 | dq/40 | ast/40 | to/40 | a/to | stl/40 | blk/40 | ||
|---|---|---|---|---|---|---|---|---|---|---|---|---|---|---|
| Event | Total | 24 | 24 | 28.5 | 1.8 | 5.7 | 7.5 | 2.6 | 0.0 | 3.7 | 2.1 | 1.8 | 2.2 | 0.3 |
| Conference | 18 | 18 | 28.8 | 1.2 | 5.7 | 6.9 | 2.7 | 0.0 | 3.9 | 2.3 | 1.7 | 2.1 | 0.2 | |
| Exhibition | - | - | - | - | - | - | - | - | - | - | - | - | - | |
| Location | Home | 12 | 12 | 26.7 | 2.6 | 5.4 | 8.0 | 3.6 | 0.0 | 4.5 | 2.3 | 2.0 | 2.8 | 0.1 |
| Away | 11 | 11 | 30.1 | 0.7 | 5.9 | 6.6 | 1.8 | 0.0 | 3.3 | 2.2 | 1.5 | 1.7 | 0.5 | |
| Neutral | 1 | 1 | 34.0 | 3.5 | 7.1 | 10.6 | 1.2 | 0.0 | 0.0 | 0.0 | - | 1.2 | 0.0 | |
| Result | Wins | 16 | 16 | 27.4 | 1.9 | 5.5 | 7.4 | 2.8 | 0.0 | 3.6 | 2.4 | 1.5 | 2.1 | 0.4 |
| Losses | 8 | 8 | 30.8 | 1.5 | 6.2 | 7.6 | 2.3 | 0.0 | 3.9 | 1.6 | 2.4 | 2.3 | 0.2 | |
| Month | November | 7 | 7 | 25.4 | 2.2 | 4.7 | 7.0 | 3.8 | 0.0 | 4.9 | 2.7 | 1.8 | 1.6 | 0.4 |
| December | 4 | 4 | 32.3 | 1.9 | 5.9 | 7.8 | 2.8 | 0.0 | 3.7 | 1.6 | 2.4 | 3.7 | 0.0 | |
| January | 9 | 9 | 30.0 | 2.1 | 5.5 | 7.6 | 2.1 | 0.0 | 2.7 | 1.9 | 1.4 | 1.8 | 0.3 | |
| February | 4 | 4 | 27.0 | 0.0 | 7.8 | 7.8 | 1.9 | 0.0 | 4.1 | 2.2 | 1.8 | 2.2 | 0.4 |